English vs Korean Single Father Households
COMPARE
English
Korean
Single Father Households
Single Father Households Comparison
English
Koreans
2.3%
SINGLE FATHER HOUSEHOLDS
68.6/ 100
METRIC RATING
166th/ 347
METRIC RANK
2.4%
SINGLE FATHER HOUSEHOLDS
24.1/ 100
METRIC RATING
206th/ 347
METRIC RANK
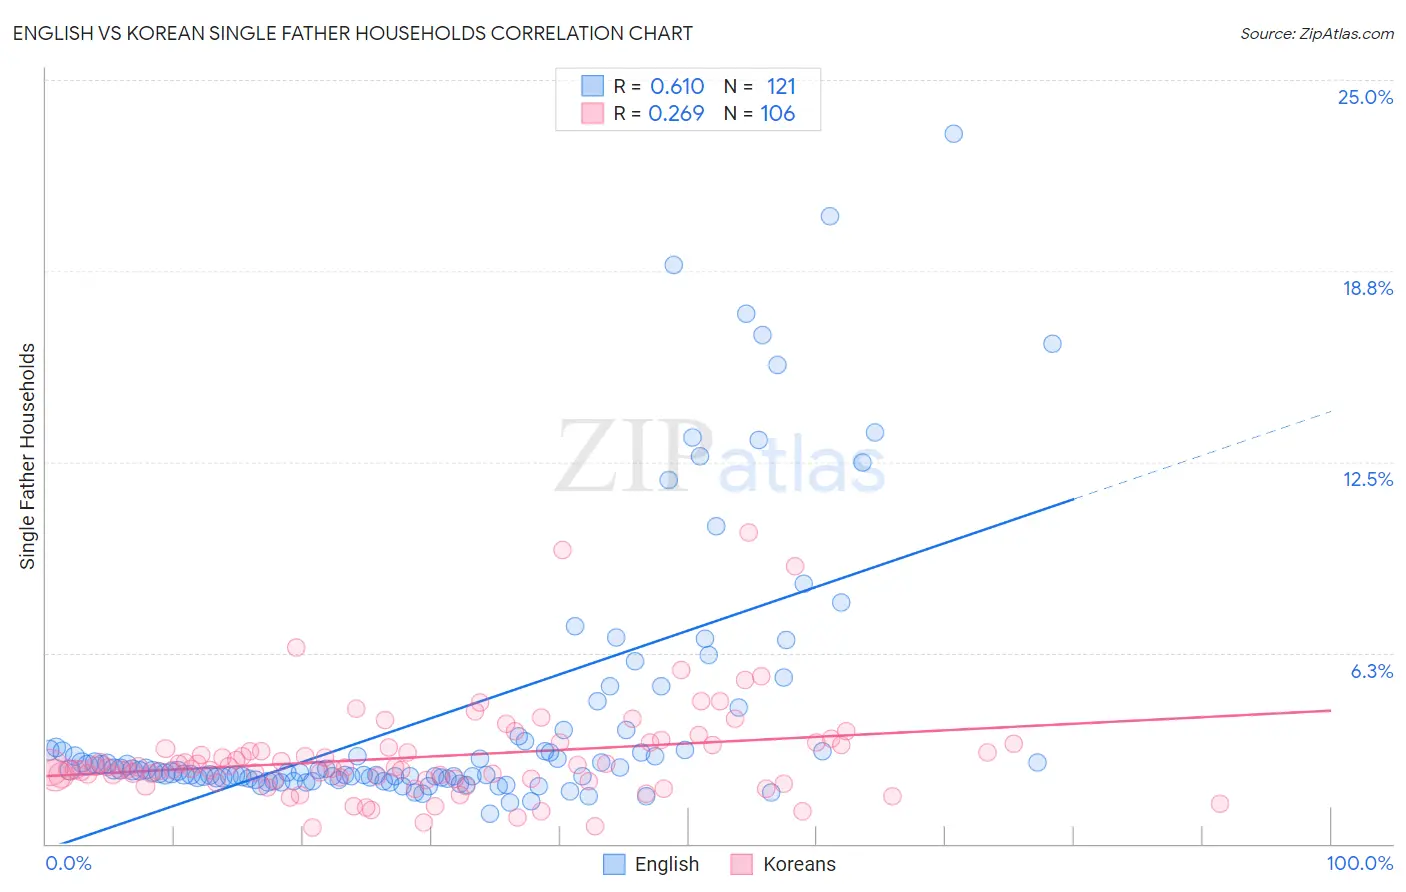
English vs Korean Single Father Households Correlation Chart
The statistical analysis conducted on geographies consisting of 561,704,434 people shows a significant positive correlation between the proportion of English and percentage of single father households in the United States with a correlation coefficient (R) of 0.610 and weighted average of 2.3%. Similarly, the statistical analysis conducted on geographies consisting of 503,655,227 people shows a weak positive correlation between the proportion of Koreans and percentage of single father households in the United States with a correlation coefficient (R) of 0.269 and weighted average of 2.4%, a difference of 3.6%.
Single Father Households Correlation Summary
| Measurement | English | Korean |
| Minimum | 0.99% | 0.54% |
| Maximum | 23.3% | 10.2% |
| Range | 22.3% | 9.7% |
| Mean | 4.3% | 2.8% |
| Median | 2.4% | 2.5% |
| Interquartile 25% (IQ1) | 2.2% | 2.1% |
| Interquartile 75% (IQ3) | 3.4% | 3.2% |
| Interquartile Range (IQR) | 1.3% | 1.1% |
| Standard Deviation (Sample) | 4.4% | 1.6% |
| Standard Deviation (Population) | 4.4% | 1.6% |
Similar Demographics by Single Father Households
Demographics Similar to English by Single Father Households
In terms of single father households, the demographic groups most similar to English are Scotch-Irish (2.3%, a difference of 0.070%), Pakistani (2.3%, a difference of 0.17%), Irish (2.3%, a difference of 0.31%), South American (2.3%, a difference of 0.36%), and Scottish (2.3%, a difference of 0.38%).
| Demographics | Rating | Rank | Single Father Households |
| Immigrants | West Indies | 77.9 /100 | #159 | Good 2.3% |
| Immigrants | Bolivia | 76.3 /100 | #160 | Good 2.3% |
| Swiss | 73.2 /100 | #161 | Good 2.3% |
| Scottish | 72.8 /100 | #162 | Good 2.3% |
| Irish | 72.1 /100 | #163 | Good 2.3% |
| Pakistanis | 70.6 /100 | #164 | Good 2.3% |
| Scotch-Irish | 69.4 /100 | #165 | Good 2.3% |
| English | 68.6 /100 | #166 | Good 2.3% |
| South Americans | 64.3 /100 | #167 | Good 2.3% |
| Icelanders | 63.1 /100 | #168 | Good 2.3% |
| Czechs | 62.5 /100 | #169 | Good 2.3% |
| Ugandans | 62.2 /100 | #170 | Good 2.3% |
| Swedes | 61.6 /100 | #171 | Good 2.3% |
| Czechoslovakians | 58.9 /100 | #172 | Average 2.3% |
| Celtics | 55.4 /100 | #173 | Average 2.3% |
Demographics Similar to Koreans by Single Father Households
In terms of single father households, the demographic groups most similar to Koreans are Immigrants from Afghanistan (2.4%, a difference of 0.0%), Ecuadorian (2.4%, a difference of 0.030%), French Canadian (2.4%, a difference of 0.060%), German Russian (2.4%, a difference of 0.15%), and White/Caucasian (2.4%, a difference of 0.15%).
| Demographics | Rating | Rank | Single Father Households |
| Immigrants | Vietnam | 27.1 /100 | #199 | Fair 2.4% |
| Peruvians | 27.1 /100 | #200 | Fair 2.4% |
| Immigrants | Uganda | 26.0 /100 | #201 | Fair 2.4% |
| German Russians | 25.7 /100 | #202 | Fair 2.4% |
| French Canadians | 24.7 /100 | #203 | Fair 2.4% |
| Ecuadorians | 24.5 /100 | #204 | Fair 2.4% |
| Immigrants | Afghanistan | 24.2 /100 | #205 | Fair 2.4% |
| Koreans | 24.1 /100 | #206 | Fair 2.4% |
| Whites/Caucasians | 22.6 /100 | #207 | Fair 2.4% |
| Immigrants | Kenya | 20.3 /100 | #208 | Fair 2.4% |
| Immigrants | Peru | 19.3 /100 | #209 | Poor 2.4% |
| Immigrants | Costa Rica | 19.2 /100 | #210 | Poor 2.4% |
| Immigrants | Nigeria | 18.7 /100 | #211 | Poor 2.4% |
| Finns | 18.3 /100 | #212 | Poor 2.4% |
| Norwegians | 17.1 /100 | #213 | Poor 2.4% |