English vs Palestinian Unemployment Among Seniors over 65 years
COMPARE
English
Palestinian
Unemployment Among Seniors over 65 years
Unemployment Among Seniors over 65 years Comparison
English
Palestinians
4.9%
UNEMPLOYMENT AMONG SENIORS OVER 65 YEARS
99.5/ 100
METRIC RATING
66th/ 347
METRIC RANK
4.8%
UNEMPLOYMENT AMONG SENIORS OVER 65 YEARS
100.0/ 100
METRIC RATING
33rd/ 347
METRIC RANK
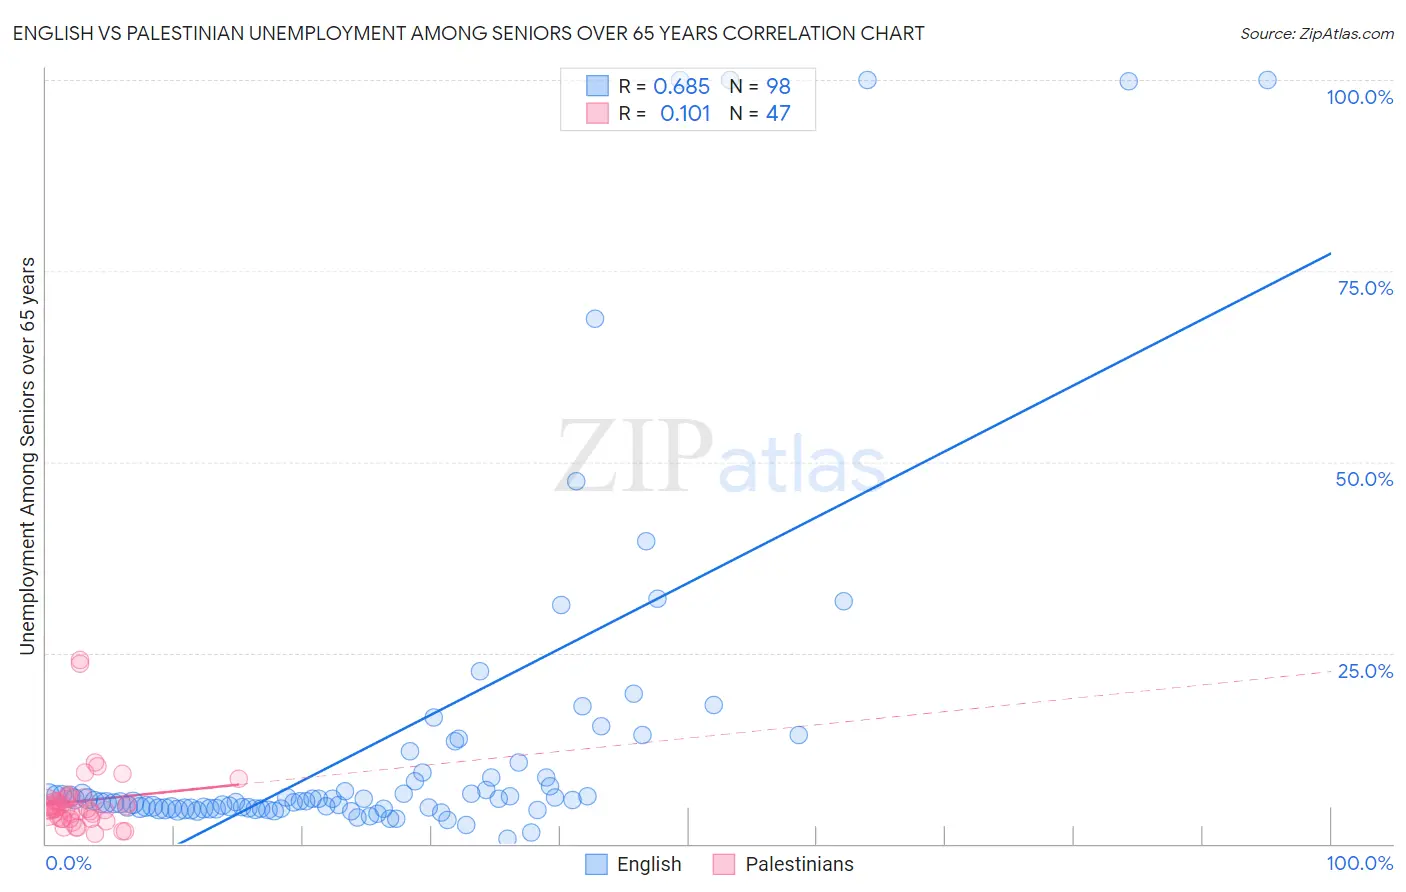
English vs Palestinian Unemployment Among Seniors over 65 years Correlation Chart
The statistical analysis conducted on geographies consisting of 463,344,936 people shows a significant positive correlation between the proportion of English and unemployment rate amomg seniors over the age of 65 in the United States with a correlation coefficient (R) of 0.685 and weighted average of 4.9%. Similarly, the statistical analysis conducted on geographies consisting of 205,968,161 people shows a poor positive correlation between the proportion of Palestinians and unemployment rate amomg seniors over the age of 65 in the United States with a correlation coefficient (R) of 0.101 and weighted average of 4.8%, a difference of 2.4%.
Unemployment Among Seniors over 65 years Correlation Summary
| Measurement | English | Palestinian |
| Minimum | 0.63% | 1.3% |
| Maximum | 100.0% | 24.1% |
| Range | 99.4% | 22.8% |
| Mean | 13.6% | 5.6% |
| Median | 5.7% | 4.6% |
| Interquartile 25% (IQ1) | 4.6% | 3.3% |
| Interquartile 75% (IQ3) | 8.7% | 5.9% |
| Interquartile Range (IQR) | 4.1% | 2.7% |
| Standard Deviation (Sample) | 22.4% | 4.4% |
| Standard Deviation (Population) | 22.3% | 4.4% |
Similar Demographics by Unemployment Among Seniors over 65 years
Demographics Similar to English by Unemployment Among Seniors over 65 years
In terms of unemployment among seniors over 65 years, the demographic groups most similar to English are Iroquois (4.9%, a difference of 0.020%), Immigrants from Nicaragua (4.9%, a difference of 0.050%), Bolivian (4.9%, a difference of 0.060%), Scottish (4.9%, a difference of 0.10%), and Croatian (4.9%, a difference of 0.13%).
| Demographics | Rating | Rank | Unemployment Among Seniors over 65 years |
| Immigrants | Eastern Africa | 99.7 /100 | #59 | Exceptional 4.9% |
| Immigrants | Middle Africa | 99.7 /100 | #60 | Exceptional 4.9% |
| Northern Europeans | 99.7 /100 | #61 | Exceptional 4.9% |
| Latvians | 99.6 /100 | #62 | Exceptional 4.9% |
| Croatians | 99.6 /100 | #63 | Exceptional 4.9% |
| Immigrants | Cambodia | 99.6 /100 | #64 | Exceptional 4.9% |
| Immigrants | Nicaragua | 99.6 /100 | #65 | Exceptional 4.9% |
| English | 99.5 /100 | #66 | Exceptional 4.9% |
| Iroquois | 99.5 /100 | #67 | Exceptional 4.9% |
| Bolivians | 99.5 /100 | #68 | Exceptional 4.9% |
| Scottish | 99.5 /100 | #69 | Exceptional 4.9% |
| Immigrants | Kazakhstan | 99.4 /100 | #70 | Exceptional 4.9% |
| Immigrants | Moldova | 99.4 /100 | #71 | Exceptional 4.9% |
| Nicaraguans | 99.3 /100 | #72 | Exceptional 4.9% |
| Immigrants | Japan | 99.2 /100 | #73 | Exceptional 4.9% |
Demographics Similar to Palestinians by Unemployment Among Seniors over 65 years
In terms of unemployment among seniors over 65 years, the demographic groups most similar to Palestinians are Immigrants from Uganda (4.8%, a difference of 0.090%), Slovene (4.8%, a difference of 0.090%), Belgian (4.8%, a difference of 0.30%), Bhutanese (4.8%, a difference of 0.34%), and Immigrants from Kuwait (4.8%, a difference of 0.36%).
| Demographics | Rating | Rank | Unemployment Among Seniors over 65 years |
| Immigrants | Lebanon | 100.0 /100 | #26 | Exceptional 4.8% |
| Houma | 100.0 /100 | #27 | Exceptional 4.8% |
| Ugandans | 100.0 /100 | #28 | Exceptional 4.8% |
| Immigrants | North Macedonia | 100.0 /100 | #29 | Exceptional 4.8% |
| Belgians | 100.0 /100 | #30 | Exceptional 4.8% |
| Immigrants | Uganda | 100.0 /100 | #31 | Exceptional 4.8% |
| Slovenes | 100.0 /100 | #32 | Exceptional 4.8% |
| Palestinians | 100.0 /100 | #33 | Exceptional 4.8% |
| Bhutanese | 100.0 /100 | #34 | Exceptional 4.8% |
| Immigrants | Kuwait | 100.0 /100 | #35 | Exceptional 4.8% |
| Cambodians | 100.0 /100 | #36 | Exceptional 4.8% |
| Bulgarians | 99.9 /100 | #37 | Exceptional 4.8% |
| Immigrants | India | 99.9 /100 | #38 | Exceptional 4.8% |
| Macedonians | 99.9 /100 | #39 | Exceptional 4.8% |
| Immigrants | Sweden | 99.9 /100 | #40 | Exceptional 4.8% |