Egyptian vs Lithuanian Single Mother Households
COMPARE
Egyptian
Lithuanian
Single Mother Households
Single Mother Households Comparison
Egyptians
Lithuanians
5.9%
SINGLE MOTHER HOUSEHOLDS
90.7/ 100
METRIC RATING
133rd/ 347
METRIC RANK
5.4%
SINGLE MOTHER HOUSEHOLDS
99.4/ 100
METRIC RATING
44th/ 347
METRIC RANK
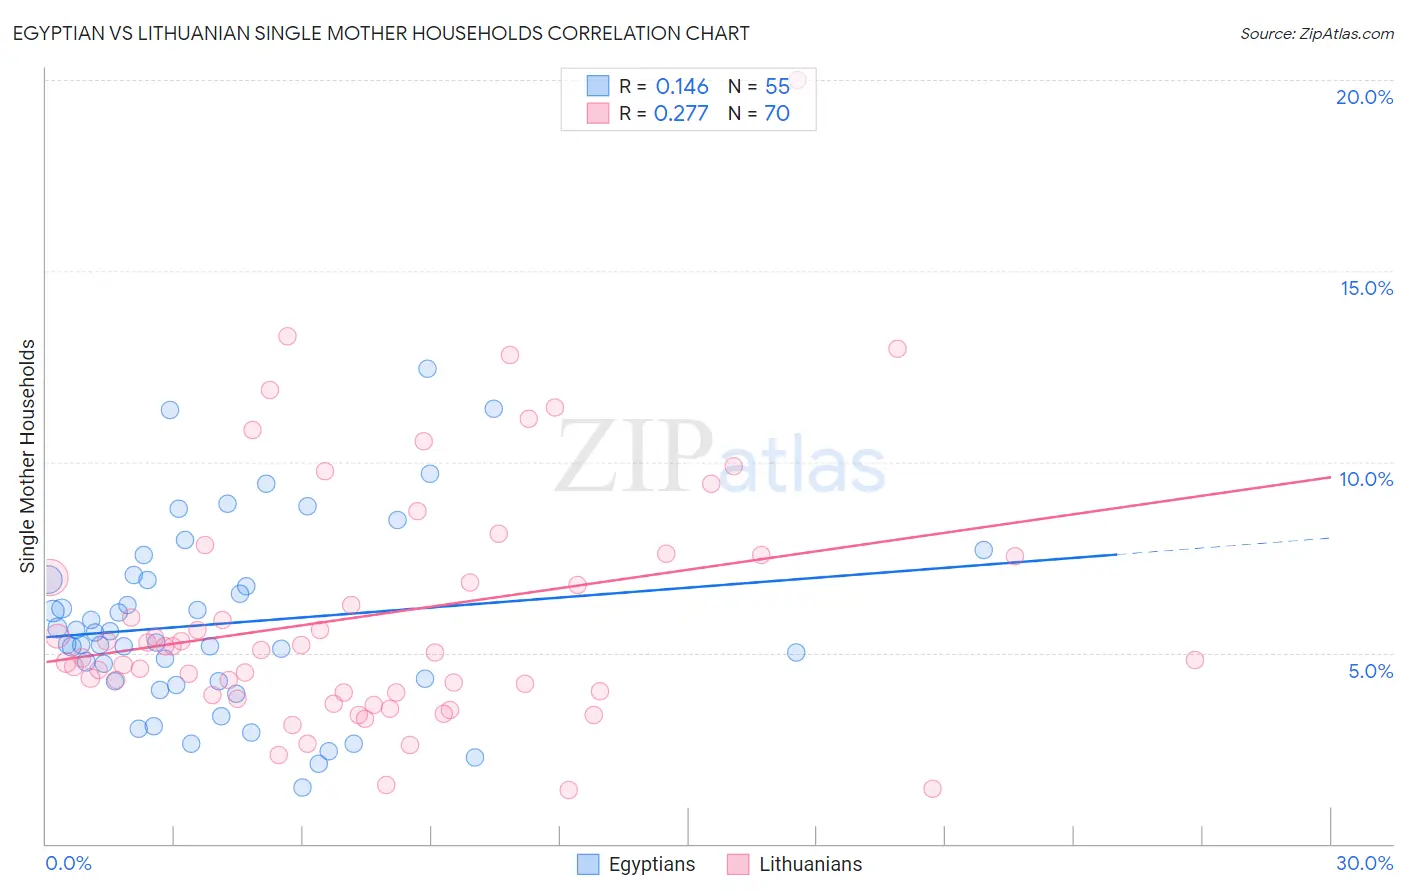
Egyptian vs Lithuanian Single Mother Households Correlation Chart
The statistical analysis conducted on geographies consisting of 276,342,561 people shows a poor positive correlation between the proportion of Egyptians and percentage of single mother households in the United States with a correlation coefficient (R) of 0.146 and weighted average of 5.9%. Similarly, the statistical analysis conducted on geographies consisting of 420,116,191 people shows a weak positive correlation between the proportion of Lithuanians and percentage of single mother households in the United States with a correlation coefficient (R) of 0.277 and weighted average of 5.4%, a difference of 8.9%.
Single Mother Households Correlation Summary
| Measurement | Egyptian | Lithuanian |
| Minimum | 1.5% | 1.4% |
| Maximum | 12.4% | 20.0% |
| Range | 11.0% | 18.6% |
| Mean | 5.8% | 6.0% |
| Median | 5.3% | 5.0% |
| Interquartile 25% (IQ1) | 4.2% | 4.0% |
| Interquartile 75% (IQ3) | 6.9% | 7.5% |
| Interquartile Range (IQR) | 2.7% | 3.6% |
| Standard Deviation (Sample) | 2.4% | 3.3% |
| Standard Deviation (Population) | 2.4% | 3.3% |
Similar Demographics by Single Mother Households
Demographics Similar to Egyptians by Single Mother Households
In terms of single mother households, the demographic groups most similar to Egyptians are Canadian (5.9%, a difference of 0.060%), Albanian (5.9%, a difference of 0.15%), Immigrants from Saudi Arabia (5.9%, a difference of 0.15%), Immigrants from Spain (5.9%, a difference of 0.20%), and Palestinian (5.9%, a difference of 0.55%).
| Demographics | Rating | Rank | Single Mother Households |
| Welsh | 92.8 /100 | #126 | Exceptional 5.9% |
| Lebanese | 92.4 /100 | #127 | Exceptional 5.9% |
| Czechoslovakians | 92.2 /100 | #128 | Exceptional 5.9% |
| Immigrants | Bolivia | 92.2 /100 | #129 | Exceptional 5.9% |
| Palestinians | 92.1 /100 | #130 | Exceptional 5.9% |
| Immigrants | Spain | 91.2 /100 | #131 | Exceptional 5.9% |
| Albanians | 91.1 /100 | #132 | Exceptional 5.9% |
| Egyptians | 90.7 /100 | #133 | Exceptional 5.9% |
| Canadians | 90.5 /100 | #134 | Exceptional 5.9% |
| Immigrants | Saudi Arabia | 90.2 /100 | #135 | Exceptional 5.9% |
| Jordanians | 88.9 /100 | #136 | Excellent 6.0% |
| Immigrants | Pakistan | 88.4 /100 | #137 | Excellent 6.0% |
| Icelanders | 86.9 /100 | #138 | Excellent 6.0% |
| Syrians | 86.0 /100 | #139 | Excellent 6.0% |
| French | 85.7 /100 | #140 | Excellent 6.0% |
Demographics Similar to Lithuanians by Single Mother Households
In terms of single mother households, the demographic groups most similar to Lithuanians are Immigrants from Croatia (5.4%, a difference of 0.12%), Croatian (5.5%, a difference of 0.38%), Norwegian (5.5%, a difference of 0.56%), Immigrants from South Central Asia (5.4%, a difference of 0.70%), and Macedonian (5.4%, a difference of 0.76%).
| Demographics | Rating | Rank | Single Mother Households |
| Immigrants | Belgium | 99.7 /100 | #37 | Exceptional 5.3% |
| Immigrants | Serbia | 99.6 /100 | #38 | Exceptional 5.4% |
| Immigrants | Sweden | 99.6 /100 | #39 | Exceptional 5.4% |
| Estonians | 99.6 /100 | #40 | Exceptional 5.4% |
| Immigrants | Greece | 99.5 /100 | #41 | Exceptional 5.4% |
| Macedonians | 99.5 /100 | #42 | Exceptional 5.4% |
| Immigrants | South Central Asia | 99.5 /100 | #43 | Exceptional 5.4% |
| Lithuanians | 99.4 /100 | #44 | Exceptional 5.4% |
| Immigrants | Croatia | 99.4 /100 | #45 | Exceptional 5.4% |
| Croatians | 99.3 /100 | #46 | Exceptional 5.5% |
| Norwegians | 99.3 /100 | #47 | Exceptional 5.5% |
| Turks | 99.2 /100 | #48 | Exceptional 5.5% |
| Immigrants | Latvia | 99.2 /100 | #49 | Exceptional 5.5% |
| Immigrants | Scotland | 99.2 /100 | #50 | Exceptional 5.5% |
| Immigrants | Belarus | 99.2 /100 | #51 | Exceptional 5.5% |