Egyptian vs Immigrants from Dominican Republic Single Mother Households
COMPARE
Egyptian
Immigrants from Dominican Republic
Single Mother Households
Single Mother Households Comparison
Egyptians
Immigrants from Dominican Republic
5.9%
SINGLE MOTHER HOUSEHOLDS
90.7/ 100
METRIC RATING
133rd/ 347
METRIC RANK
9.5%
SINGLE MOTHER HOUSEHOLDS
0.0/ 100
METRIC RATING
344th/ 347
METRIC RANK
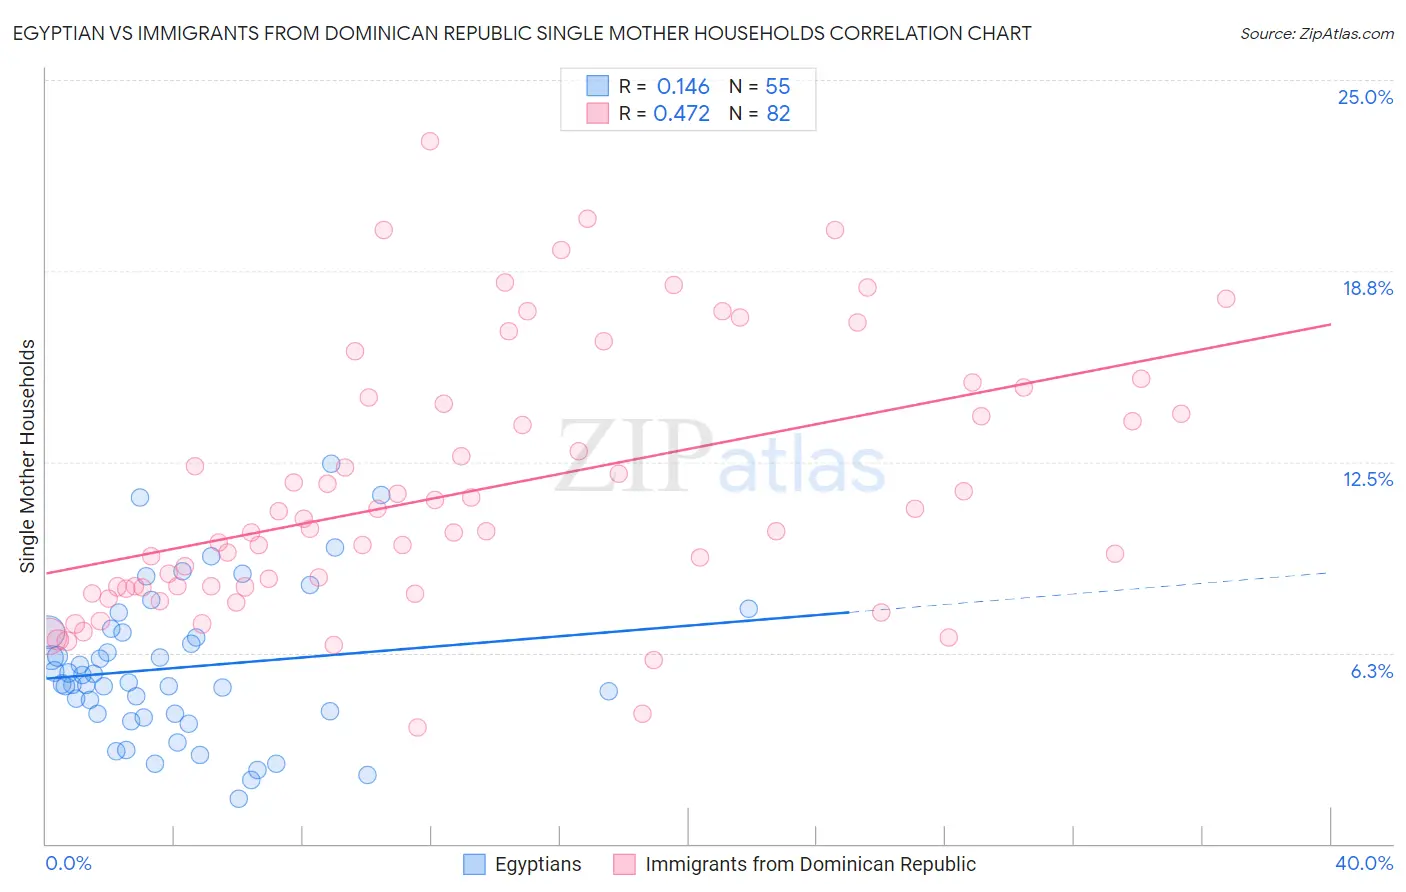
Egyptian vs Immigrants from Dominican Republic Single Mother Households Correlation Chart
The statistical analysis conducted on geographies consisting of 276,342,561 people shows a poor positive correlation between the proportion of Egyptians and percentage of single mother households in the United States with a correlation coefficient (R) of 0.146 and weighted average of 5.9%. Similarly, the statistical analysis conducted on geographies consisting of 274,598,570 people shows a moderate positive correlation between the proportion of Immigrants from Dominican Republic and percentage of single mother households in the United States with a correlation coefficient (R) of 0.472 and weighted average of 9.5%, a difference of 60.6%.
Single Mother Households Correlation Summary
| Measurement | Egyptian | Immigrants from Dominican Republic |
| Minimum | 1.5% | 3.8% |
| Maximum | 12.4% | 23.0% |
| Range | 11.0% | 19.2% |
| Mean | 5.8% | 11.5% |
| Median | 5.3% | 10.3% |
| Interquartile 25% (IQ1) | 4.2% | 8.4% |
| Interquartile 75% (IQ3) | 6.9% | 14.4% |
| Interquartile Range (IQR) | 2.7% | 6.0% |
| Standard Deviation (Sample) | 2.4% | 4.2% |
| Standard Deviation (Population) | 2.4% | 4.2% |
Similar Demographics by Single Mother Households
Demographics Similar to Egyptians by Single Mother Households
In terms of single mother households, the demographic groups most similar to Egyptians are Canadian (5.9%, a difference of 0.060%), Albanian (5.9%, a difference of 0.15%), Immigrants from Saudi Arabia (5.9%, a difference of 0.15%), Immigrants from Spain (5.9%, a difference of 0.20%), and Palestinian (5.9%, a difference of 0.55%).
| Demographics | Rating | Rank | Single Mother Households |
| Welsh | 92.8 /100 | #126 | Exceptional 5.9% |
| Lebanese | 92.4 /100 | #127 | Exceptional 5.9% |
| Czechoslovakians | 92.2 /100 | #128 | Exceptional 5.9% |
| Immigrants | Bolivia | 92.2 /100 | #129 | Exceptional 5.9% |
| Palestinians | 92.1 /100 | #130 | Exceptional 5.9% |
| Immigrants | Spain | 91.2 /100 | #131 | Exceptional 5.9% |
| Albanians | 91.1 /100 | #132 | Exceptional 5.9% |
| Egyptians | 90.7 /100 | #133 | Exceptional 5.9% |
| Canadians | 90.5 /100 | #134 | Exceptional 5.9% |
| Immigrants | Saudi Arabia | 90.2 /100 | #135 | Exceptional 5.9% |
| Jordanians | 88.9 /100 | #136 | Excellent 6.0% |
| Immigrants | Pakistan | 88.4 /100 | #137 | Excellent 6.0% |
| Icelanders | 86.9 /100 | #138 | Excellent 6.0% |
| Syrians | 86.0 /100 | #139 | Excellent 6.0% |
| French | 85.7 /100 | #140 | Excellent 6.0% |
Demographics Similar to Immigrants from Dominican Republic by Single Mother Households
In terms of single mother households, the demographic groups most similar to Immigrants from Dominican Republic are Immigrants from Cabo Verde (9.6%, a difference of 0.78%), Yuman (9.6%, a difference of 1.4%), Dominican (9.2%, a difference of 3.5%), Menominee (9.2%, a difference of 3.7%), and Tohono O'odham (9.1%, a difference of 4.1%).
| Demographics | Rating | Rank | Single Mother Households |
| Liberians | 0.0 /100 | #333 | Tragic 8.6% |
| Immigrants | Liberia | 0.0 /100 | #334 | Tragic 8.7% |
| Immigrants | Dominica | 0.0 /100 | #335 | Tragic 8.7% |
| Puerto Ricans | 0.0 /100 | #336 | Tragic 8.7% |
| Navajo | 0.0 /100 | #337 | Tragic 8.8% |
| Cape Verdeans | 0.0 /100 | #338 | Tragic 8.9% |
| Blacks/African Americans | 0.0 /100 | #339 | Tragic 9.0% |
| Lumbee | 0.0 /100 | #340 | Tragic 9.1% |
| Tohono O'odham | 0.0 /100 | #341 | Tragic 9.1% |
| Menominee | 0.0 /100 | #342 | Tragic 9.2% |
| Dominicans | 0.0 /100 | #343 | Tragic 9.2% |
| Immigrants | Dominican Republic | 0.0 /100 | #344 | Tragic 9.5% |
| Immigrants | Cabo Verde | 0.0 /100 | #345 | Tragic 9.6% |
| Yuman | 0.0 /100 | #346 | Tragic 9.6% |
| Yup'ik | 0.0 /100 | #347 | Tragic 10.0% |