Egyptian vs Immigrants from Jamaica Single Mother Households
COMPARE
Egyptian
Immigrants from Jamaica
Single Mother Households
Single Mother Households Comparison
Egyptians
Immigrants from Jamaica
5.9%
SINGLE MOTHER HOUSEHOLDS
90.7/ 100
METRIC RATING
133rd/ 347
METRIC RANK
8.4%
SINGLE MOTHER HOUSEHOLDS
0.0/ 100
METRIC RATING
324th/ 347
METRIC RANK
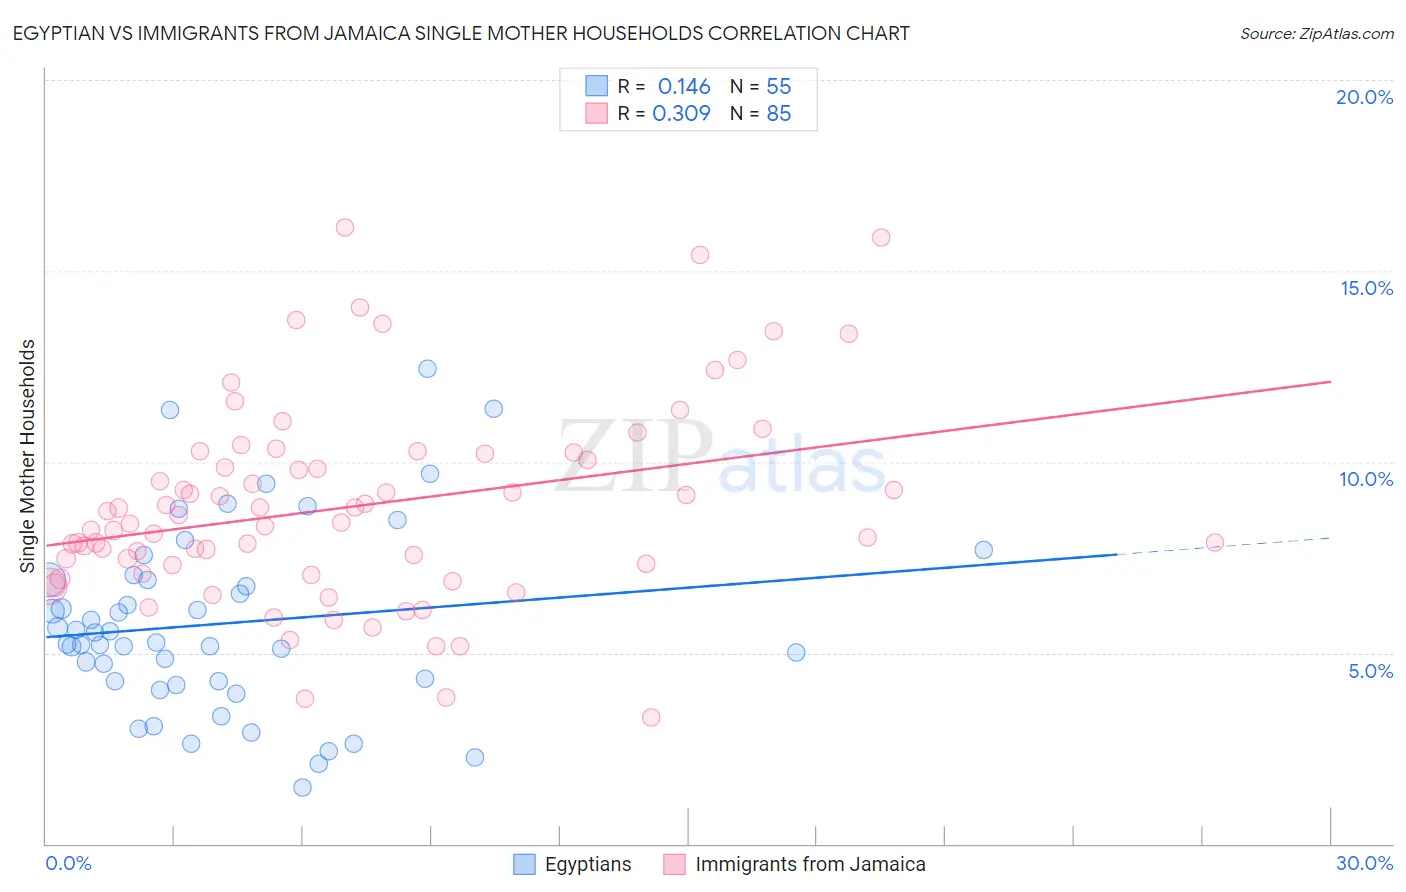
Egyptian vs Immigrants from Jamaica Single Mother Households Correlation Chart
The statistical analysis conducted on geographies consisting of 276,342,561 people shows a poor positive correlation between the proportion of Egyptians and percentage of single mother households in the United States with a correlation coefficient (R) of 0.146 and weighted average of 5.9%. Similarly, the statistical analysis conducted on geographies consisting of 301,259,043 people shows a mild positive correlation between the proportion of Immigrants from Jamaica and percentage of single mother households in the United States with a correlation coefficient (R) of 0.309 and weighted average of 8.4%, a difference of 41.2%.
Single Mother Households Correlation Summary
| Measurement | Egyptian | Immigrants from Jamaica |
| Minimum | 1.5% | 3.3% |
| Maximum | 12.4% | 16.1% |
| Range | 11.0% | 12.8% |
| Mean | 5.8% | 8.8% |
| Median | 5.3% | 8.4% |
| Interquartile 25% (IQ1) | 4.2% | 7.2% |
| Interquartile 75% (IQ3) | 6.9% | 10.2% |
| Interquartile Range (IQR) | 2.7% | 3.0% |
| Standard Deviation (Sample) | 2.4% | 2.6% |
| Standard Deviation (Population) | 2.4% | 2.6% |
Similar Demographics by Single Mother Households
Demographics Similar to Egyptians by Single Mother Households
In terms of single mother households, the demographic groups most similar to Egyptians are Canadian (5.9%, a difference of 0.060%), Albanian (5.9%, a difference of 0.15%), Immigrants from Saudi Arabia (5.9%, a difference of 0.15%), Immigrants from Spain (5.9%, a difference of 0.20%), and Palestinian (5.9%, a difference of 0.55%).
| Demographics | Rating | Rank | Single Mother Households |
| Welsh | 92.8 /100 | #126 | Exceptional 5.9% |
| Lebanese | 92.4 /100 | #127 | Exceptional 5.9% |
| Czechoslovakians | 92.2 /100 | #128 | Exceptional 5.9% |
| Immigrants | Bolivia | 92.2 /100 | #129 | Exceptional 5.9% |
| Palestinians | 92.1 /100 | #130 | Exceptional 5.9% |
| Immigrants | Spain | 91.2 /100 | #131 | Exceptional 5.9% |
| Albanians | 91.1 /100 | #132 | Exceptional 5.9% |
| Egyptians | 90.7 /100 | #133 | Exceptional 5.9% |
| Canadians | 90.5 /100 | #134 | Exceptional 5.9% |
| Immigrants | Saudi Arabia | 90.2 /100 | #135 | Exceptional 5.9% |
| Jordanians | 88.9 /100 | #136 | Excellent 6.0% |
| Immigrants | Pakistan | 88.4 /100 | #137 | Excellent 6.0% |
| Icelanders | 86.9 /100 | #138 | Excellent 6.0% |
| Syrians | 86.0 /100 | #139 | Excellent 6.0% |
| French | 85.7 /100 | #140 | Excellent 6.0% |
Demographics Similar to Immigrants from Jamaica by Single Mother Households
In terms of single mother households, the demographic groups most similar to Immigrants from Jamaica are Immigrants from Caribbean (8.4%, a difference of 0.18%), British West Indian (8.4%, a difference of 0.31%), Haitian (8.3%, a difference of 0.43%), Immigrants from Haiti (8.4%, a difference of 0.46%), and Yakama (8.4%, a difference of 0.63%).
| Demographics | Rating | Rank | Single Mother Households |
| Immigrants | Honduras | 0.0 /100 | #317 | Tragic 8.2% |
| Senegalese | 0.0 /100 | #318 | Tragic 8.2% |
| Jamaicans | 0.0 /100 | #319 | Tragic 8.2% |
| Bahamians | 0.0 /100 | #320 | Tragic 8.3% |
| Immigrants | Senegal | 0.0 /100 | #321 | Tragic 8.3% |
| Pima | 0.0 /100 | #322 | Tragic 8.3% |
| Haitians | 0.0 /100 | #323 | Tragic 8.3% |
| Immigrants | Jamaica | 0.0 /100 | #324 | Tragic 8.4% |
| Immigrants | Caribbean | 0.0 /100 | #325 | Tragic 8.4% |
| British West Indians | 0.0 /100 | #326 | Tragic 8.4% |
| Immigrants | Haiti | 0.0 /100 | #327 | Tragic 8.4% |
| Yakama | 0.0 /100 | #328 | Tragic 8.4% |
| Hopi | 0.0 /100 | #329 | Tragic 8.5% |
| Inupiat | 0.0 /100 | #330 | Tragic 8.5% |
| Sioux | 0.0 /100 | #331 | Tragic 8.5% |