Afghan vs Panamanian Currently Married
COMPARE
Afghan
Panamanian
Currently Married
Currently Married Comparison
Afghans
Panamanians
47.3%
CURRENTLY MARRIED
81.8/ 100
METRIC RATING
132nd/ 347
METRIC RANK
45.3%
CURRENTLY MARRIED
4.0/ 100
METRIC RATING
218th/ 347
METRIC RANK
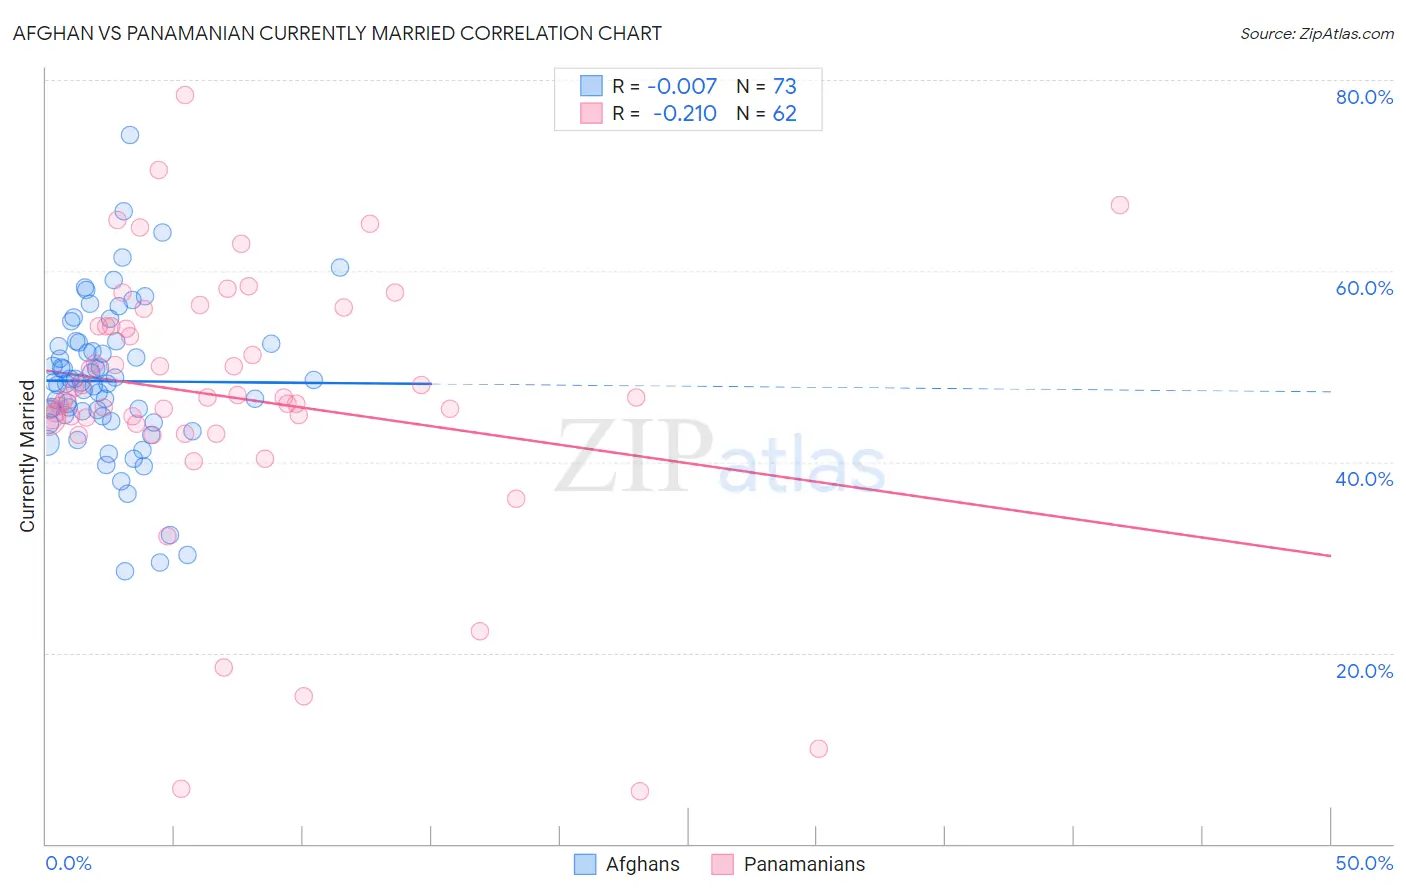
Afghan vs Panamanian Currently Married Correlation Chart
The statistical analysis conducted on geographies consisting of 148,861,336 people shows no correlation between the proportion of Afghans and percentage of population currently married in the United States with a correlation coefficient (R) of -0.007 and weighted average of 47.3%. Similarly, the statistical analysis conducted on geographies consisting of 281,208,339 people shows a weak negative correlation between the proportion of Panamanians and percentage of population currently married in the United States with a correlation coefficient (R) of -0.210 and weighted average of 45.3%, a difference of 4.4%.
Currently Married Correlation Summary
| Measurement | Afghan | Panamanian |
| Minimum | 28.6% | 5.5% |
| Maximum | 74.2% | 78.4% |
| Range | 45.6% | 72.9% |
| Mean | 48.5% | 46.8% |
| Median | 48.3% | 46.8% |
| Interquartile 25% (IQ1) | 44.5% | 44.6% |
| Interquartile 75% (IQ3) | 52.5% | 54.2% |
| Interquartile Range (IQR) | 8.0% | 9.5% |
| Standard Deviation (Sample) | 8.0% | 14.0% |
| Standard Deviation (Population) | 7.9% | 13.9% |
Similar Demographics by Currently Married
Demographics Similar to Afghans by Currently Married
In terms of currently married, the demographic groups most similar to Afghans are Icelander (47.3%, a difference of 0.040%), Immigrants from Malaysia (47.3%, a difference of 0.040%), Immigrants from Australia (47.3%, a difference of 0.050%), Immigrants from Iraq (47.3%, a difference of 0.060%), and Sri Lankan (47.3%, a difference of 0.090%).
| Demographics | Rating | Rank | Currently Married |
| Okinawans | 85.3 /100 | #125 | Excellent 47.4% |
| Immigrants | Jordan | 84.9 /100 | #126 | Excellent 47.4% |
| New Zealanders | 84.9 /100 | #127 | Excellent 47.4% |
| Portuguese | 84.2 /100 | #128 | Excellent 47.3% |
| Sri Lankans | 83.2 /100 | #129 | Excellent 47.3% |
| Immigrants | Iraq | 82.8 /100 | #130 | Excellent 47.3% |
| Icelanders | 82.4 /100 | #131 | Excellent 47.3% |
| Afghans | 81.8 /100 | #132 | Excellent 47.3% |
| Immigrants | Malaysia | 81.1 /100 | #133 | Excellent 47.3% |
| Immigrants | Australia | 81.1 /100 | #134 | Excellent 47.3% |
| Immigrants | Norway | 79.7 /100 | #135 | Good 47.2% |
| Immigrants | Vietnam | 78.2 /100 | #136 | Good 47.2% |
| Paraguayans | 77.8 /100 | #137 | Good 47.2% |
| Pakistanis | 77.5 /100 | #138 | Good 47.2% |
| Yugoslavians | 77.4 /100 | #139 | Good 47.2% |
Demographics Similar to Panamanians by Currently Married
In terms of currently married, the demographic groups most similar to Panamanians are Immigrants from Portugal (45.2%, a difference of 0.12%), Immigrants from Thailand (45.4%, a difference of 0.24%), Kenyan (45.2%, a difference of 0.24%), Mexican (45.2%, a difference of 0.26%), and Immigrants from Morocco (45.4%, a difference of 0.33%).
| Demographics | Rating | Rank | Currently Married |
| Houma | 7.2 /100 | #211 | Tragic 45.5% |
| Marshallese | 7.2 /100 | #212 | Tragic 45.5% |
| Alaska Natives | 7.0 /100 | #213 | Tragic 45.5% |
| Dutch West Indians | 6.7 /100 | #214 | Tragic 45.5% |
| German Russians | 6.7 /100 | #215 | Tragic 45.5% |
| Immigrants | Morocco | 5.5 /100 | #216 | Tragic 45.4% |
| Immigrants | Thailand | 5.1 /100 | #217 | Tragic 45.4% |
| Panamanians | 4.0 /100 | #218 | Tragic 45.3% |
| Immigrants | Portugal | 3.5 /100 | #219 | Tragic 45.2% |
| Kenyans | 3.1 /100 | #220 | Tragic 45.2% |
| Mexicans | 3.0 /100 | #221 | Tragic 45.2% |
| Immigrants | Azores | 2.5 /100 | #222 | Tragic 45.1% |
| Immigrants | Laos | 2.3 /100 | #223 | Tragic 45.0% |
| Immigrants | Uganda | 2.2 /100 | #224 | Tragic 45.0% |
| French American Indians | 2.2 /100 | #225 | Tragic 45.0% |