Ecuadorian vs French Canadian Disability Age 18 to 34
COMPARE
Ecuadorian
French Canadian
Disability Age 18 to 34
Disability Age 18 to 34 Comparison
Ecuadorians
French Canadians
5.8%
DISABILITY AGE 18 TO 34
99.9/ 100
METRIC RATING
36th/ 347
METRIC RANK
8.1%
DISABILITY AGE 18 TO 34
0.0/ 100
METRIC RATING
318th/ 347
METRIC RANK
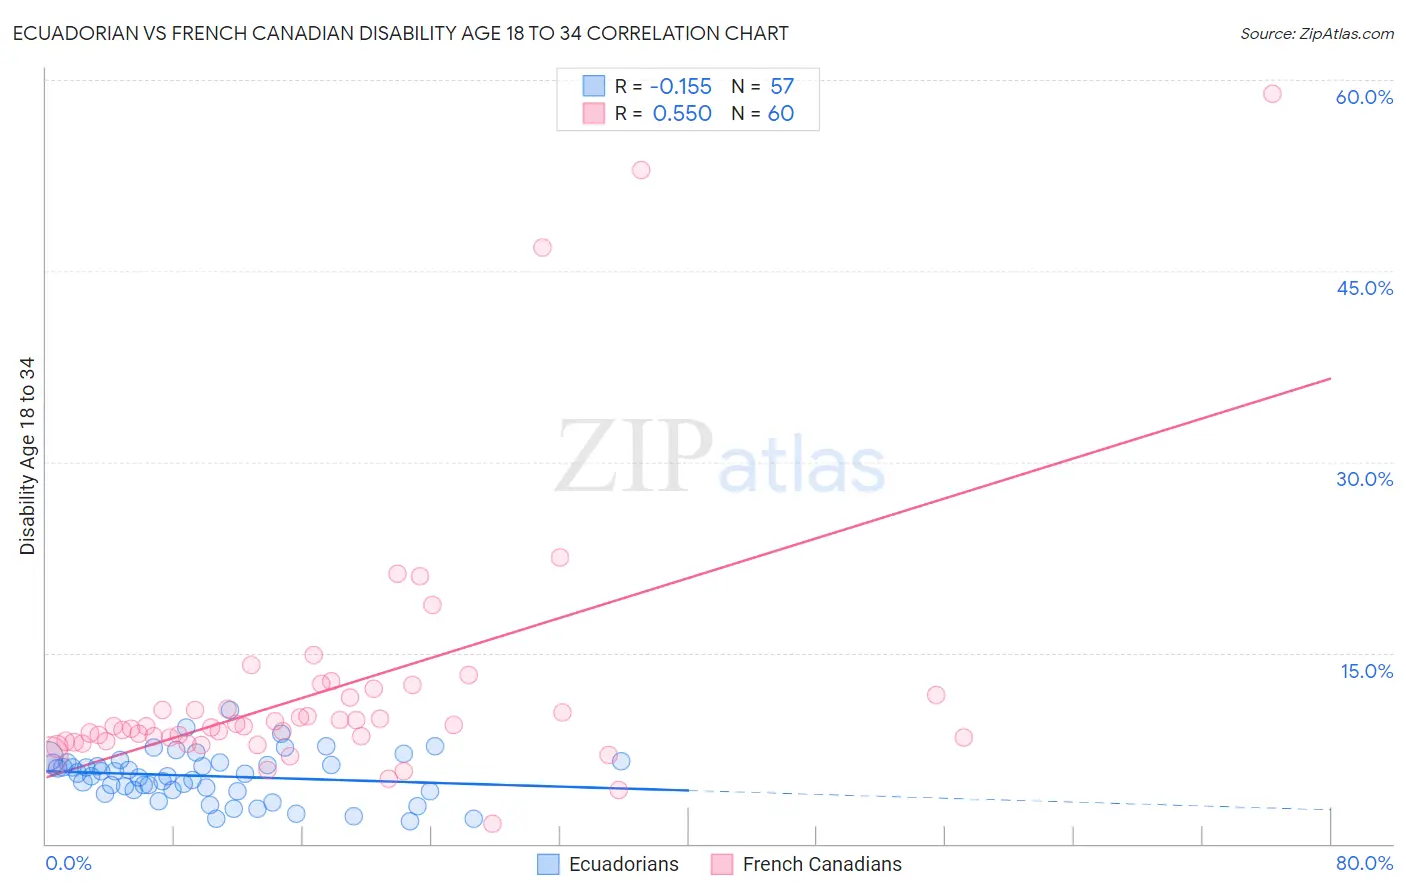
Ecuadorian vs French Canadian Disability Age 18 to 34 Correlation Chart
The statistical analysis conducted on geographies consisting of 317,415,300 people shows a poor negative correlation between the proportion of Ecuadorians and percentage of population with a disability between the ages 18 and 35 in the United States with a correlation coefficient (R) of -0.155 and weighted average of 5.8%. Similarly, the statistical analysis conducted on geographies consisting of 499,728,064 people shows a substantial positive correlation between the proportion of French Canadians and percentage of population with a disability between the ages 18 and 35 in the United States with a correlation coefficient (R) of 0.550 and weighted average of 8.1%, a difference of 39.3%.
Disability Age 18 to 34 Correlation Summary
| Measurement | Ecuadorian | French Canadian |
| Minimum | 1.7% | 1.6% |
| Maximum | 10.5% | 58.9% |
| Range | 8.8% | 57.3% |
| Mean | 5.3% | 12.1% |
| Median | 5.5% | 9.2% |
| Interquartile 25% (IQ1) | 4.2% | 8.1% |
| Interquartile 75% (IQ3) | 6.4% | 11.6% |
| Interquartile Range (IQR) | 2.2% | 3.5% |
| Standard Deviation (Sample) | 1.9% | 10.2% |
| Standard Deviation (Population) | 1.9% | 10.1% |
Similar Demographics by Disability Age 18 to 34
Demographics Similar to Ecuadorians by Disability Age 18 to 34
In terms of disability age 18 to 34, the demographic groups most similar to Ecuadorians are Armenian (5.8%, a difference of 0.090%), Immigrants from South America (5.8%, a difference of 0.11%), Immigrants from Lithuania (5.8%, a difference of 0.15%), Venezuelan (5.8%, a difference of 0.38%), and Asian (5.8%, a difference of 0.42%).
| Demographics | Rating | Rank | Disability Age 18 to 34 |
| Immigrants | Ecuador | 99.9 /100 | #29 | Exceptional 5.7% |
| Immigrants | Pakistan | 99.9 /100 | #30 | Exceptional 5.8% |
| Iranians | 99.9 /100 | #31 | Exceptional 5.8% |
| Immigrants | Barbados | 99.9 /100 | #32 | Exceptional 5.8% |
| Argentineans | 99.9 /100 | #33 | Exceptional 5.8% |
| Venezuelans | 99.9 /100 | #34 | Exceptional 5.8% |
| Immigrants | Lithuania | 99.9 /100 | #35 | Exceptional 5.8% |
| Ecuadorians | 99.9 /100 | #36 | Exceptional 5.8% |
| Armenians | 99.9 /100 | #37 | Exceptional 5.8% |
| Immigrants | South America | 99.9 /100 | #38 | Exceptional 5.8% |
| Asians | 99.9 /100 | #39 | Exceptional 5.8% |
| Bolivians | 99.9 /100 | #40 | Exceptional 5.8% |
| Nicaraguans | 99.9 /100 | #41 | Exceptional 5.8% |
| Colombians | 99.8 /100 | #42 | Exceptional 5.9% |
| South Americans | 99.8 /100 | #43 | Exceptional 5.9% |
Demographics Similar to French Canadians by Disability Age 18 to 34
In terms of disability age 18 to 34, the demographic groups most similar to French Canadians are Aleut (8.1%, a difference of 0.040%), Navajo (8.1%, a difference of 0.090%), Hmong (8.1%, a difference of 0.42%), Blackfeet (8.1%, a difference of 0.45%), and Cree (8.1%, a difference of 0.51%).
| Demographics | Rating | Rank | Disability Age 18 to 34 |
| French | 0.0 /100 | #311 | Tragic 7.9% |
| Spanish Americans | 0.0 /100 | #312 | Tragic 7.9% |
| Iroquois | 0.0 /100 | #313 | Tragic 7.9% |
| Colville | 0.0 /100 | #314 | Tragic 7.9% |
| Americans | 0.0 /100 | #315 | Tragic 8.0% |
| Puerto Ricans | 0.0 /100 | #316 | Tragic 8.0% |
| Hmong | 0.0 /100 | #317 | Tragic 8.1% |
| French Canadians | 0.0 /100 | #318 | Tragic 8.1% |
| Aleuts | 0.0 /100 | #319 | Tragic 8.1% |
| Navajo | 0.0 /100 | #320 | Tragic 8.1% |
| Blackfeet | 0.0 /100 | #321 | Tragic 8.1% |
| Cree | 0.0 /100 | #322 | Tragic 8.1% |
| French American Indians | 0.0 /100 | #323 | Tragic 8.2% |
| Cajuns | 0.0 /100 | #324 | Tragic 8.2% |
| Natives/Alaskans | 0.0 /100 | #325 | Tragic 8.2% |