South American Indian vs Immigrants from Sierra Leone Divorced or Separated
COMPARE
South American Indian
Immigrants from Sierra Leone
Divorced or Separated
Divorced or Separated Comparison
South American Indians
Immigrants from Sierra Leone
11.8%
DIVORCED OR SEPARATED
92.1/ 100
METRIC RATING
126th/ 347
METRIC RANK
12.1%
DIVORCED OR SEPARATED
50.0/ 100
METRIC RATING
175th/ 347
METRIC RANK
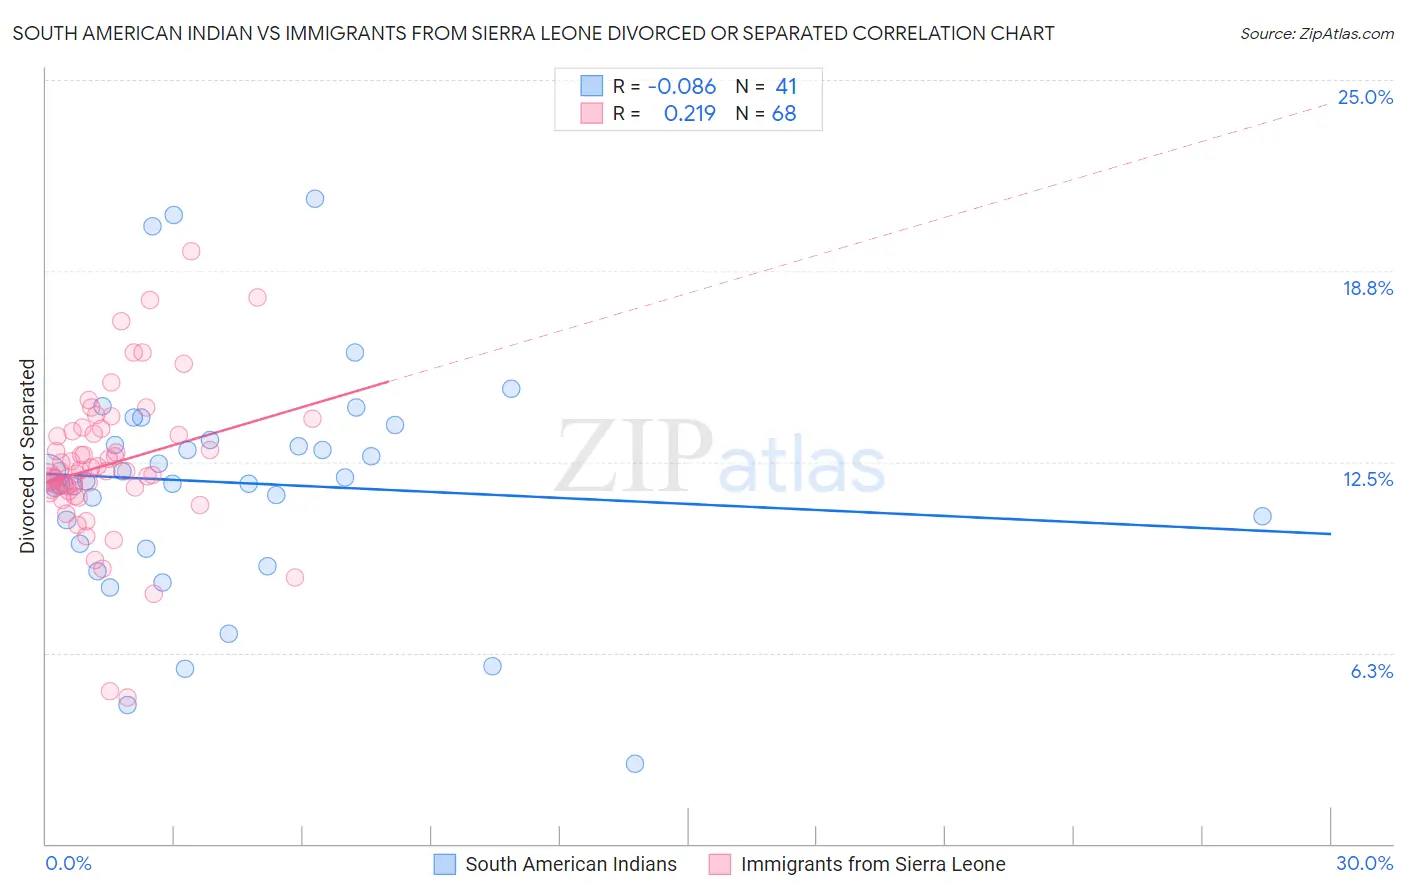
South American Indian vs Immigrants from Sierra Leone Divorced or Separated Correlation Chart
The statistical analysis conducted on geographies consisting of 164,560,857 people shows a slight negative correlation between the proportion of South American Indians and percentage of population currently divorced or separated in the United States with a correlation coefficient (R) of -0.086 and weighted average of 11.8%. Similarly, the statistical analysis conducted on geographies consisting of 101,651,089 people shows a weak positive correlation between the proportion of Immigrants from Sierra Leone and percentage of population currently divorced or separated in the United States with a correlation coefficient (R) of 0.219 and weighted average of 12.1%, a difference of 2.2%.
Divorced or Separated Correlation Summary
| Measurement | South American Indian | Immigrants from Sierra Leone |
| Minimum | 2.6% | 4.8% |
| Maximum | 21.1% | 19.4% |
| Range | 18.5% | 14.6% |
| Mean | 11.8% | 12.4% |
| Median | 11.9% | 12.2% |
| Interquartile 25% (IQ1) | 9.7% | 11.6% |
| Interquartile 75% (IQ3) | 13.4% | 13.5% |
| Interquartile Range (IQR) | 3.7% | 1.9% |
| Standard Deviation (Sample) | 3.8% | 2.4% |
| Standard Deviation (Population) | 3.8% | 2.4% |
Similar Demographics by Divorced or Separated
Demographics Similar to South American Indians by Divorced or Separated
In terms of divorced or separated, the demographic groups most similar to South American Indians are Ukrainian (11.8%, a difference of 0.020%), Ugandan (11.8%, a difference of 0.13%), Immigrants (11.8%, a difference of 0.21%), Menominee (11.8%, a difference of 0.22%), and Romanian (11.8%, a difference of 0.34%).
| Demographics | Rating | Rank | Divorced or Separated |
| Syrians | 95.1 /100 | #119 | Exceptional 11.7% |
| Iraqis | 94.6 /100 | #120 | Exceptional 11.8% |
| Romanians | 94.5 /100 | #121 | Exceptional 11.8% |
| Menominee | 93.8 /100 | #122 | Exceptional 11.8% |
| Immigrants | Immigrants | 93.7 /100 | #123 | Exceptional 11.8% |
| Ugandans | 93.1 /100 | #124 | Exceptional 11.8% |
| Ukrainians | 92.3 /100 | #125 | Exceptional 11.8% |
| South American Indians | 92.1 /100 | #126 | Exceptional 11.8% |
| South Africans | 88.9 /100 | #127 | Excellent 11.8% |
| Immigrants | Ecuador | 88.9 /100 | #128 | Excellent 11.8% |
| Immigrants | St. Vincent and the Grenadines | 88.4 /100 | #129 | Excellent 11.8% |
| Immigrants | Austria | 88.2 /100 | #130 | Excellent 11.8% |
| Immigrants | Cambodia | 88.2 /100 | #131 | Excellent 11.8% |
| Immigrants | Afghanistan | 87.9 /100 | #132 | Excellent 11.8% |
| New Zealanders | 87.5 /100 | #133 | Excellent 11.9% |
Demographics Similar to Immigrants from Sierra Leone by Divorced or Separated
In terms of divorced or separated, the demographic groups most similar to Immigrants from Sierra Leone are Hawaiian (12.1%, a difference of 0.0%), Immigrants from Moldova (12.1%, a difference of 0.020%), Pennsylvania German (12.1%, a difference of 0.040%), Brazilian (12.1%, a difference of 0.080%), and Immigrants from Mexico (12.0%, a difference of 0.11%).
| Demographics | Rating | Rank | Divorced or Separated |
| Serbians | 57.1 /100 | #168 | Average 12.0% |
| Immigrants | Peru | 57.0 /100 | #169 | Average 12.0% |
| Mexican American Indians | 55.8 /100 | #170 | Average 12.0% |
| Costa Ricans | 53.3 /100 | #171 | Average 12.0% |
| Immigrants | Mexico | 53.2 /100 | #172 | Average 12.0% |
| Immigrants | Moldova | 50.4 /100 | #173 | Average 12.1% |
| Hawaiians | 50.0 /100 | #174 | Average 12.1% |
| Immigrants | Sierra Leone | 50.0 /100 | #175 | Average 12.1% |
| Pennsylvania Germans | 48.9 /100 | #176 | Average 12.1% |
| Brazilians | 47.7 /100 | #177 | Average 12.1% |
| Ghanaians | 45.9 /100 | #178 | Average 12.1% |
| Immigrants | Western Europe | 45.6 /100 | #179 | Average 12.1% |
| Barbadians | 45.0 /100 | #180 | Average 12.1% |
| Immigrants | Canada | 44.0 /100 | #181 | Average 12.1% |
| Immigrants | Ethiopia | 43.1 /100 | #182 | Average 12.1% |