Swedish vs Immigrants from Sierra Leone Divorced or Separated
COMPARE
Swedish
Immigrants from Sierra Leone
Divorced or Separated
Divorced or Separated Comparison
Swedes
Immigrants from Sierra Leone
12.1%
DIVORCED OR SEPARATED
34.4/ 100
METRIC RATING
191st/ 347
METRIC RANK
12.1%
DIVORCED OR SEPARATED
50.0/ 100
METRIC RATING
175th/ 347
METRIC RANK
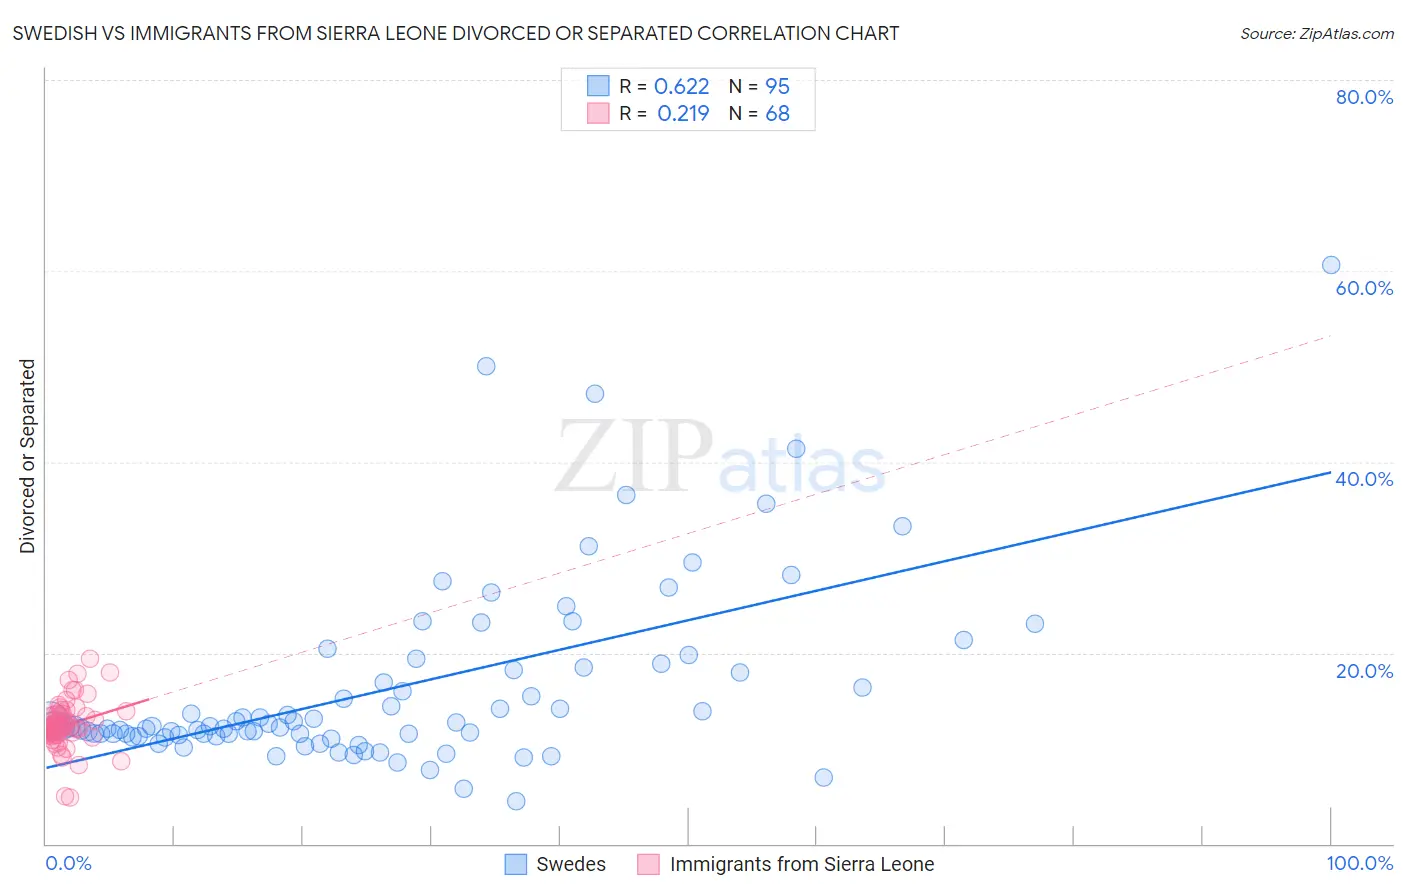
Swedish vs Immigrants from Sierra Leone Divorced or Separated Correlation Chart
The statistical analysis conducted on geographies consisting of 538,888,854 people shows a significant positive correlation between the proportion of Swedes and percentage of population currently divorced or separated in the United States with a correlation coefficient (R) of 0.622 and weighted average of 12.1%. Similarly, the statistical analysis conducted on geographies consisting of 101,651,089 people shows a weak positive correlation between the proportion of Immigrants from Sierra Leone and percentage of population currently divorced or separated in the United States with a correlation coefficient (R) of 0.219 and weighted average of 12.1%, a difference of 0.56%.
Divorced or Separated Correlation Summary
| Measurement | Swedish | Immigrants from Sierra Leone |
| Minimum | 4.5% | 4.8% |
| Maximum | 60.6% | 19.4% |
| Range | 56.1% | 14.6% |
| Mean | 16.3% | 12.4% |
| Median | 12.3% | 12.2% |
| Interquartile 25% (IQ1) | 11.4% | 11.6% |
| Interquartile 75% (IQ3) | 18.5% | 13.5% |
| Interquartile Range (IQR) | 7.2% | 1.9% |
| Standard Deviation (Sample) | 9.7% | 2.4% |
| Standard Deviation (Population) | 9.6% | 2.4% |
Demographics Similar to Swedes and Immigrants from Sierra Leone by Divorced or Separated
In terms of divorced or separated, the demographic groups most similar to Swedes are Moroccan (12.1%, a difference of 0.020%), Sierra Leonean (12.1%, a difference of 0.040%), Norwegian (12.1%, a difference of 0.050%), Immigrants from Thailand (12.1%, a difference of 0.070%), and Immigrants from Belize (12.1%, a difference of 0.12%). Similarly, the demographic groups most similar to Immigrants from Sierra Leone are Hawaiian (12.1%, a difference of 0.0%), Immigrants from Moldova (12.1%, a difference of 0.020%), Pennsylvania German (12.1%, a difference of 0.040%), Brazilian (12.1%, a difference of 0.080%), and Ghanaian (12.1%, a difference of 0.14%).
| Demographics | Rating | Rank | Divorced or Separated |
| Immigrants | Moldova | 50.4 /100 | #173 | Average 12.1% |
| Hawaiians | 50.0 /100 | #174 | Average 12.1% |
| Immigrants | Sierra Leone | 50.0 /100 | #175 | Average 12.1% |
| Pennsylvania Germans | 48.9 /100 | #176 | Average 12.1% |
| Brazilians | 47.7 /100 | #177 | Average 12.1% |
| Ghanaians | 45.9 /100 | #178 | Average 12.1% |
| Immigrants | Western Europe | 45.6 /100 | #179 | Average 12.1% |
| Barbadians | 45.0 /100 | #180 | Average 12.1% |
| Immigrants | Canada | 44.0 /100 | #181 | Average 12.1% |
| Immigrants | Ethiopia | 43.1 /100 | #182 | Average 12.1% |
| Immigrants | Central America | 42.9 /100 | #183 | Average 12.1% |
| Immigrants | North America | 41.1 /100 | #184 | Average 12.1% |
| Immigrants | Nigeria | 40.5 /100 | #185 | Average 12.1% |
| Immigrants | Chile | 39.0 /100 | #186 | Fair 12.1% |
| Belizeans | 37.7 /100 | #187 | Fair 12.1% |
| Immigrants | Belize | 37.6 /100 | #188 | Fair 12.1% |
| Sierra Leoneans | 35.5 /100 | #189 | Fair 12.1% |
| Moroccans | 34.8 /100 | #190 | Fair 12.1% |
| Swedes | 34.4 /100 | #191 | Fair 12.1% |
| Norwegians | 33.2 /100 | #192 | Fair 12.1% |
| Immigrants | Thailand | 32.5 /100 | #193 | Fair 12.1% |