Delaware vs Indonesian Currently Married
COMPARE
Delaware
Indonesian
Currently Married
Currently Married Comparison
Delaware
Indonesians
46.9%
CURRENTLY MARRIED
64.7/ 100
METRIC RATING
163rd/ 347
METRIC RANK
43.5%
CURRENTLY MARRIED
0.1/ 100
METRIC RATING
272nd/ 347
METRIC RANK
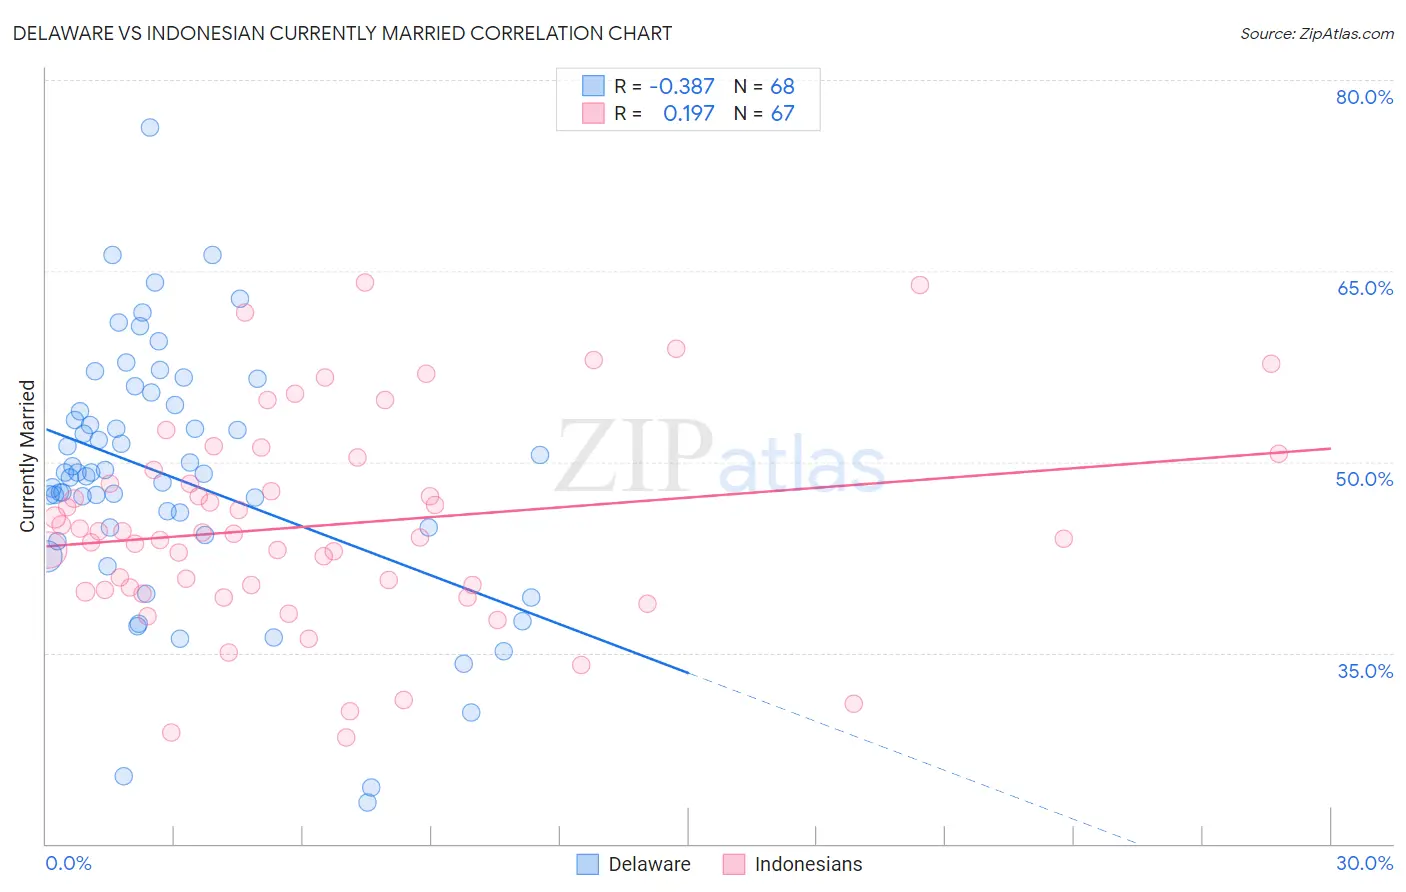
Delaware vs Indonesian Currently Married Correlation Chart
The statistical analysis conducted on geographies consisting of 96,237,198 people shows a mild negative correlation between the proportion of Delaware and percentage of population currently married in the United States with a correlation coefficient (R) of -0.387 and weighted average of 46.9%. Similarly, the statistical analysis conducted on geographies consisting of 162,724,785 people shows a poor positive correlation between the proportion of Indonesians and percentage of population currently married in the United States with a correlation coefficient (R) of 0.197 and weighted average of 43.5%, a difference of 7.9%.
Currently Married Correlation Summary
| Measurement | Delaware | Indonesian |
| Minimum | 23.2% | 28.3% |
| Maximum | 76.3% | 64.1% |
| Range | 53.1% | 35.8% |
| Mean | 48.7% | 45.0% |
| Median | 49.1% | 44.3% |
| Interquartile 25% (IQ1) | 44.5% | 39.9% |
| Interquartile 75% (IQ3) | 54.2% | 49.4% |
| Interquartile Range (IQR) | 9.7% | 9.4% |
| Standard Deviation (Sample) | 9.9% | 8.1% |
| Standard Deviation (Population) | 9.9% | 8.0% |
Similar Demographics by Currently Married
Demographics Similar to Delaware by Currently Married
In terms of currently married, the demographic groups most similar to Delaware are Immigrants from Western Asia (46.9%, a difference of 0.020%), Nonimmigrants (46.9%, a difference of 0.030%), Immigrants from Uzbekistan (46.9%, a difference of 0.050%), Immigrants from Southern Europe (46.9%, a difference of 0.050%), and Iraqi (46.9%, a difference of 0.070%).
| Demographics | Rating | Rank | Currently Married |
| Spanish | 68.1 /100 | #156 | Good 47.0% |
| Immigrants | Switzerland | 67.8 /100 | #157 | Good 46.9% |
| Cherokee | 66.8 /100 | #158 | Good 46.9% |
| Iraqis | 66.4 /100 | #159 | Good 46.9% |
| Immigrants | Uzbekistan | 66.0 /100 | #160 | Good 46.9% |
| Immigrants | Southern Europe | 65.9 /100 | #161 | Good 46.9% |
| Immigrants | Nonimmigrants | 65.4 /100 | #162 | Good 46.9% |
| Delaware | 64.7 /100 | #163 | Good 46.9% |
| Immigrants | Western Asia | 64.2 /100 | #164 | Good 46.9% |
| Samoans | 59.8 /100 | #165 | Average 46.8% |
| Immigrants | Syria | 59.3 /100 | #166 | Average 46.8% |
| Spaniards | 58.8 /100 | #167 | Average 46.8% |
| Immigrants | Afghanistan | 58.2 /100 | #168 | Average 46.8% |
| Armenians | 58.2 /100 | #169 | Average 46.8% |
| Immigrants | Latvia | 56.7 /100 | #170 | Average 46.7% |
Demographics Similar to Indonesians by Currently Married
In terms of currently married, the demographic groups most similar to Indonesians are Bermudan (43.5%, a difference of 0.040%), Yaqui (43.4%, a difference of 0.040%), Salvadoran (43.5%, a difference of 0.050%), Nigerian (43.4%, a difference of 0.060%), and Colville (43.4%, a difference of 0.080%).
| Demographics | Rating | Rank | Currently Married |
| Immigrants | Bangladesh | 0.1 /100 | #265 | Tragic 43.6% |
| Ecuadorians | 0.1 /100 | #266 | Tragic 43.6% |
| Immigrants | Eritrea | 0.1 /100 | #267 | Tragic 43.6% |
| Spanish American Indians | 0.1 /100 | #268 | Tragic 43.6% |
| Immigrants | Sudan | 0.1 /100 | #269 | Tragic 43.5% |
| Salvadorans | 0.1 /100 | #270 | Tragic 43.5% |
| Bermudans | 0.1 /100 | #271 | Tragic 43.5% |
| Indonesians | 0.1 /100 | #272 | Tragic 43.5% |
| Yaqui | 0.1 /100 | #273 | Tragic 43.4% |
| Nigerians | 0.1 /100 | #274 | Tragic 43.4% |
| Colville | 0.1 /100 | #275 | Tragic 43.4% |
| Sierra Leoneans | 0.1 /100 | #276 | Tragic 43.4% |
| Immigrants | Nigeria | 0.1 /100 | #277 | Tragic 43.4% |
| Central Americans | 0.0 /100 | #278 | Tragic 43.3% |
| Central American Indians | 0.0 /100 | #279 | Tragic 43.3% |