Delaware vs Indonesian High School Diploma
COMPARE
Delaware
Indonesian
High School Diploma
High School Diploma Comparison
Delaware
Indonesians
89.2%
HIGH SCHOOL DIPLOMA
55.8/ 100
METRIC RATING
168th/ 347
METRIC RANK
86.5%
HIGH SCHOOL DIPLOMA
0.0/ 100
METRIC RATING
281st/ 347
METRIC RANK
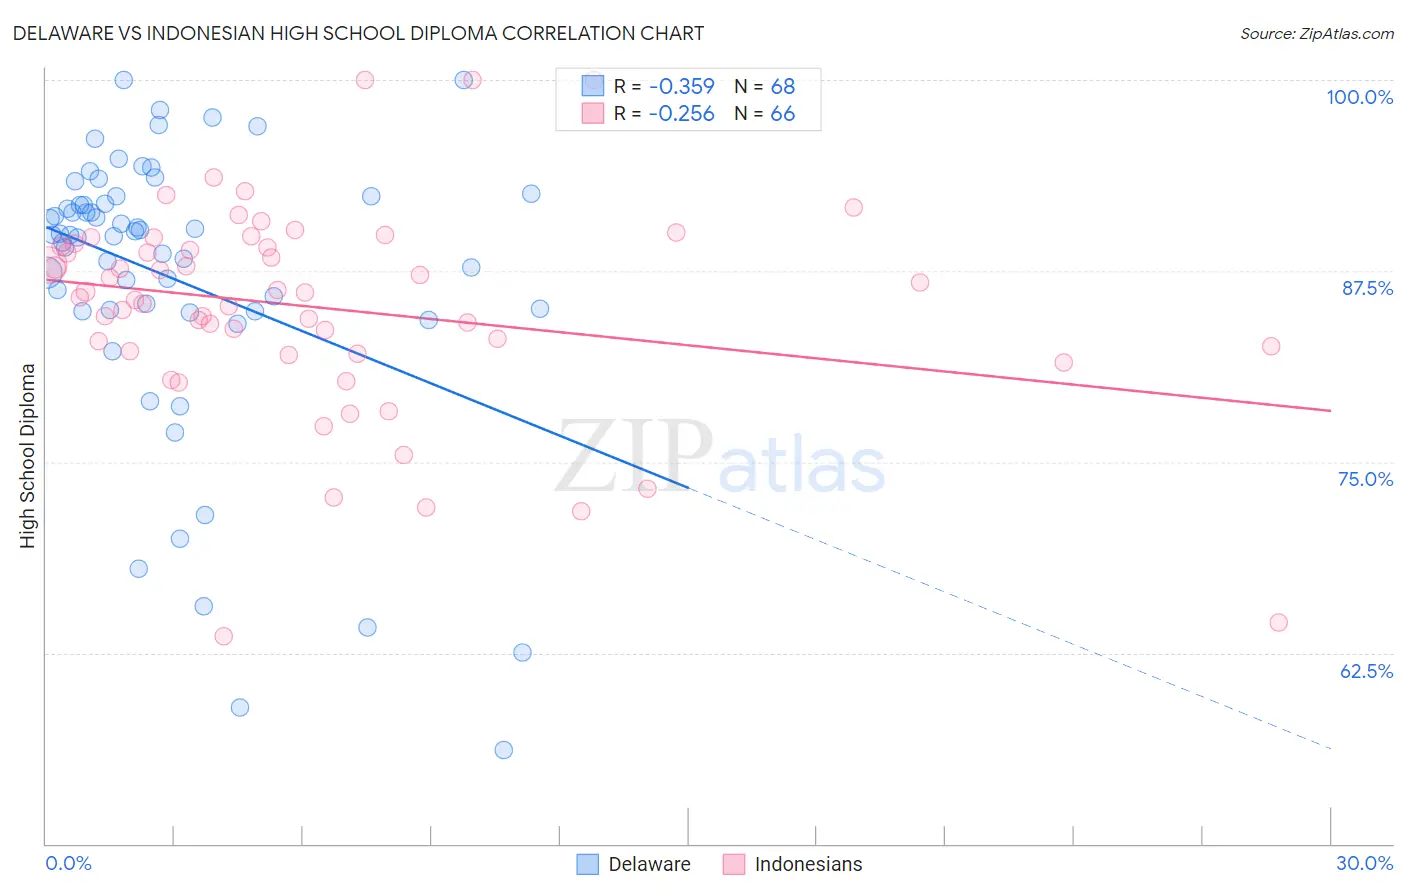
Delaware vs Indonesian High School Diploma Correlation Chart
The statistical analysis conducted on geographies consisting of 96,235,398 people shows a mild negative correlation between the proportion of Delaware and percentage of population with at least high school diploma education in the United States with a correlation coefficient (R) of -0.359 and weighted average of 89.2%. Similarly, the statistical analysis conducted on geographies consisting of 162,727,113 people shows a weak negative correlation between the proportion of Indonesians and percentage of population with at least high school diploma education in the United States with a correlation coefficient (R) of -0.256 and weighted average of 86.5%, a difference of 3.2%.
High School Diploma Correlation Summary
| Measurement | Delaware | Indonesian |
| Minimum | 56.1% | 63.6% |
| Maximum | 100.0% | 100.0% |
| Range | 43.9% | 36.4% |
| Mean | 86.9% | 85.1% |
| Median | 89.9% | 85.9% |
| Interquartile 25% (IQ1) | 84.9% | 82.2% |
| Interquartile 75% (IQ3) | 92.2% | 89.1% |
| Interquartile Range (IQR) | 7.2% | 6.9% |
| Standard Deviation (Sample) | 9.5% | 7.0% |
| Standard Deviation (Population) | 9.5% | 6.9% |
Similar Demographics by High School Diploma
Demographics Similar to Delaware by High School Diploma
In terms of high school diploma, the demographic groups most similar to Delaware are Iroquois (89.2%, a difference of 0.010%), Immigrants from Hong Kong (89.3%, a difference of 0.040%), Immigrants from Morocco (89.2%, a difference of 0.040%), Spanish (89.2%, a difference of 0.040%), and Immigrants from Asia (89.3%, a difference of 0.060%).
| Demographics | Rating | Rank | High School Diploma |
| Brazilians | 61.2 /100 | #161 | Good 89.3% |
| Bermudans | 61.1 /100 | #162 | Good 89.3% |
| Cree | 61.1 /100 | #163 | Good 89.3% |
| Immigrants | Nepal | 61.1 /100 | #164 | Good 89.3% |
| Immigrants | Asia | 59.8 /100 | #165 | Average 89.3% |
| Immigrants | Albania | 59.4 /100 | #166 | Average 89.3% |
| Immigrants | Hong Kong | 58.6 /100 | #167 | Average 89.3% |
| Delaware | 55.8 /100 | #168 | Average 89.2% |
| Iroquois | 55.1 /100 | #169 | Average 89.2% |
| Immigrants | Morocco | 53.3 /100 | #170 | Average 89.2% |
| Spanish | 52.9 /100 | #171 | Average 89.2% |
| Immigrants | Nonimmigrants | 51.8 /100 | #172 | Average 89.2% |
| Immigrants | Indonesia | 50.3 /100 | #173 | Average 89.1% |
| Hmong | 50.0 /100 | #174 | Average 89.1% |
| Immigrants | Western Asia | 49.0 /100 | #175 | Average 89.1% |
Demographics Similar to Indonesians by High School Diploma
In terms of high school diploma, the demographic groups most similar to Indonesians are Dutch West Indian (86.5%, a difference of 0.040%), Pueblo (86.5%, a difference of 0.050%), Immigrants from Laos (86.6%, a difference of 0.070%), Immigrants from Barbados (86.4%, a difference of 0.10%), and Hopi (86.6%, a difference of 0.11%).
| Demographics | Rating | Rank | High School Diploma |
| Bangladeshis | 0.1 /100 | #274 | Tragic 86.9% |
| Immigrants | Trinidad and Tobago | 0.1 /100 | #275 | Tragic 86.8% |
| Immigrants | Burma/Myanmar | 0.1 /100 | #276 | Tragic 86.7% |
| Barbadians | 0.1 /100 | #277 | Tragic 86.7% |
| Hopi | 0.1 /100 | #278 | Tragic 86.6% |
| Immigrants | Laos | 0.0 /100 | #279 | Tragic 86.6% |
| Pueblo | 0.0 /100 | #280 | Tragic 86.5% |
| Indonesians | 0.0 /100 | #281 | Tragic 86.5% |
| Dutch West Indians | 0.0 /100 | #282 | Tragic 86.5% |
| Immigrants | Barbados | 0.0 /100 | #283 | Tragic 86.4% |
| Paiute | 0.0 /100 | #284 | Tragic 86.4% |
| Immigrants | West Indies | 0.0 /100 | #285 | Tragic 86.2% |
| Immigrants | St. Vincent and the Grenadines | 0.0 /100 | #286 | Tragic 86.2% |
| Ute | 0.0 /100 | #287 | Tragic 86.2% |
| Immigrants | Vietnam | 0.0 /100 | #288 | Tragic 86.2% |