Delaware vs Immigrants from Hong Kong Currently Married
COMPARE
Delaware
Immigrants from Hong Kong
Currently Married
Currently Married Comparison
Delaware
Immigrants from Hong Kong
46.9%
CURRENTLY MARRIED
64.7/ 100
METRIC RATING
163rd/ 347
METRIC RANK
48.9%
CURRENTLY MARRIED
99.5/ 100
METRIC RATING
32nd/ 347
METRIC RANK
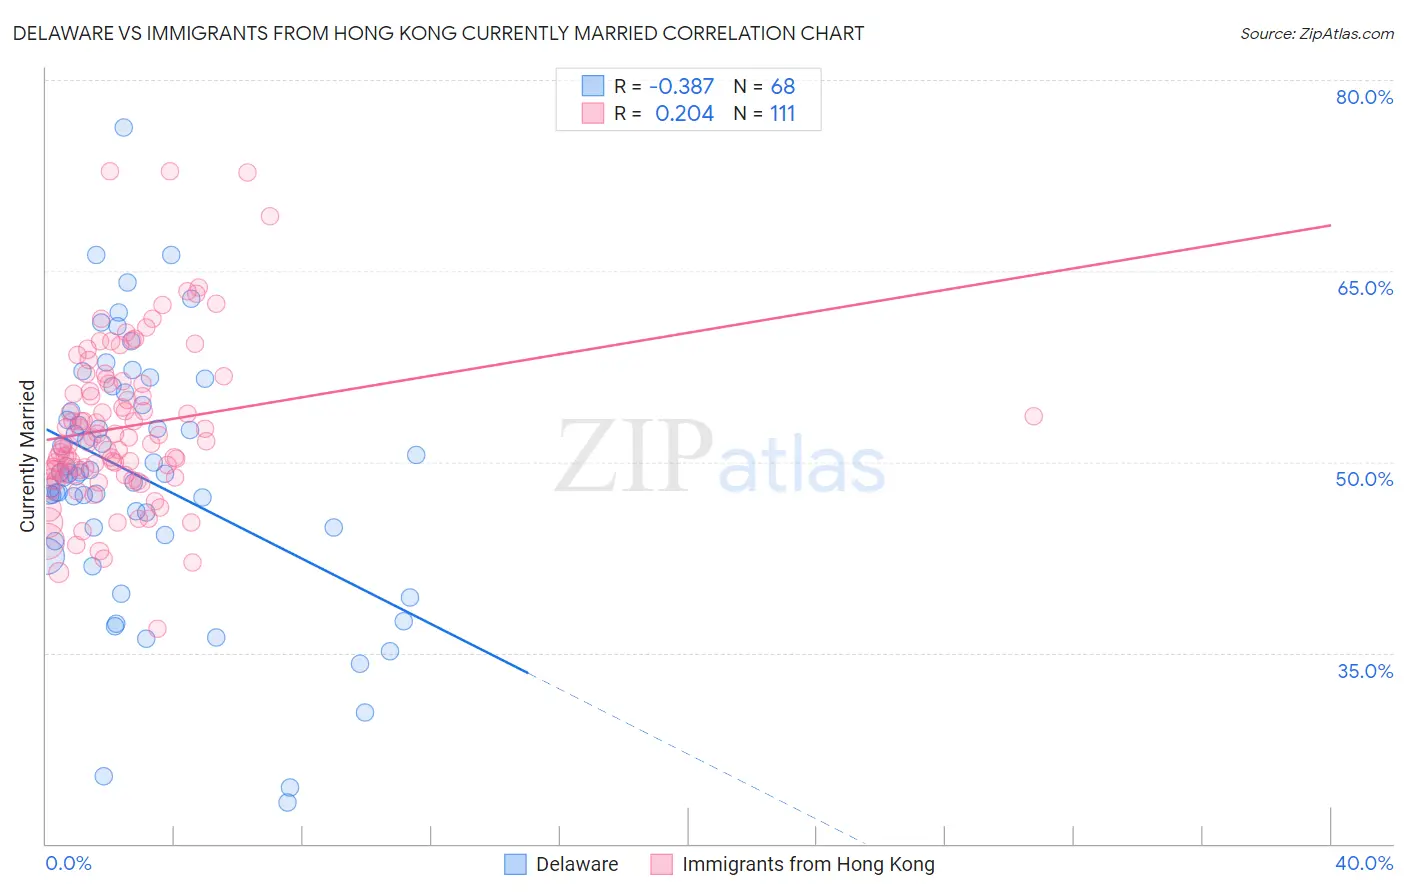
Delaware vs Immigrants from Hong Kong Currently Married Correlation Chart
The statistical analysis conducted on geographies consisting of 96,237,198 people shows a mild negative correlation between the proportion of Delaware and percentage of population currently married in the United States with a correlation coefficient (R) of -0.387 and weighted average of 46.9%. Similarly, the statistical analysis conducted on geographies consisting of 253,978,076 people shows a weak positive correlation between the proportion of Immigrants from Hong Kong and percentage of population currently married in the United States with a correlation coefficient (R) of 0.204 and weighted average of 48.9%, a difference of 4.3%.
Currently Married Correlation Summary
| Measurement | Delaware | Immigrants from Hong Kong |
| Minimum | 23.2% | 36.9% |
| Maximum | 76.3% | 72.8% |
| Range | 53.1% | 35.9% |
| Mean | 48.7% | 52.7% |
| Median | 49.1% | 51.5% |
| Interquartile 25% (IQ1) | 44.5% | 49.0% |
| Interquartile 75% (IQ3) | 54.2% | 56.1% |
| Interquartile Range (IQR) | 9.7% | 7.1% |
| Standard Deviation (Sample) | 9.9% | 6.4% |
| Standard Deviation (Population) | 9.9% | 6.4% |
Similar Demographics by Currently Married
Demographics Similar to Delaware by Currently Married
In terms of currently married, the demographic groups most similar to Delaware are Immigrants from Western Asia (46.9%, a difference of 0.020%), Nonimmigrants (46.9%, a difference of 0.030%), Immigrants from Uzbekistan (46.9%, a difference of 0.050%), Immigrants from Southern Europe (46.9%, a difference of 0.050%), and Iraqi (46.9%, a difference of 0.070%).
| Demographics | Rating | Rank | Currently Married |
| Spanish | 68.1 /100 | #156 | Good 47.0% |
| Immigrants | Switzerland | 67.8 /100 | #157 | Good 46.9% |
| Cherokee | 66.8 /100 | #158 | Good 46.9% |
| Iraqis | 66.4 /100 | #159 | Good 46.9% |
| Immigrants | Uzbekistan | 66.0 /100 | #160 | Good 46.9% |
| Immigrants | Southern Europe | 65.9 /100 | #161 | Good 46.9% |
| Immigrants | Nonimmigrants | 65.4 /100 | #162 | Good 46.9% |
| Delaware | 64.7 /100 | #163 | Good 46.9% |
| Immigrants | Western Asia | 64.2 /100 | #164 | Good 46.9% |
| Samoans | 59.8 /100 | #165 | Average 46.8% |
| Immigrants | Syria | 59.3 /100 | #166 | Average 46.8% |
| Spaniards | 58.8 /100 | #167 | Average 46.8% |
| Immigrants | Afghanistan | 58.2 /100 | #168 | Average 46.8% |
| Armenians | 58.2 /100 | #169 | Average 46.8% |
| Immigrants | Latvia | 56.7 /100 | #170 | Average 46.7% |
Demographics Similar to Immigrants from Hong Kong by Currently Married
In terms of currently married, the demographic groups most similar to Immigrants from Hong Kong are Eastern European (48.9%, a difference of 0.010%), Polish (48.9%, a difference of 0.010%), Croatian (48.9%, a difference of 0.020%), Irish (48.9%, a difference of 0.040%), and Welsh (48.9%, a difference of 0.070%).
| Demographics | Rating | Rank | Currently Married |
| Maltese | 99.6 /100 | #25 | Exceptional 49.0% |
| Immigrants | Korea | 99.6 /100 | #26 | Exceptional 49.0% |
| Burmese | 99.6 /100 | #27 | Exceptional 48.9% |
| Welsh | 99.5 /100 | #28 | Exceptional 48.9% |
| Croatians | 99.5 /100 | #29 | Exceptional 48.9% |
| Eastern Europeans | 99.5 /100 | #30 | Exceptional 48.9% |
| Poles | 99.5 /100 | #31 | Exceptional 48.9% |
| Immigrants | Hong Kong | 99.5 /100 | #32 | Exceptional 48.9% |
| Irish | 99.5 /100 | #33 | Exceptional 48.9% |
| Immigrants | Lithuania | 99.4 /100 | #34 | Exceptional 48.8% |
| Immigrants | Northern Europe | 99.4 /100 | #35 | Exceptional 48.8% |
| Italians | 99.4 /100 | #36 | Exceptional 48.8% |
| Hungarians | 99.4 /100 | #37 | Exceptional 48.8% |
| Czechoslovakians | 99.4 /100 | #38 | Exceptional 48.8% |
| British | 99.4 /100 | #39 | Exceptional 48.8% |