Delaware vs Iroquois Currently Married
COMPARE
Delaware
Iroquois
Currently Married
Currently Married Comparison
Delaware
Iroquois
46.9%
CURRENTLY MARRIED
64.7/ 100
METRIC RATING
163rd/ 347
METRIC RANK
44.7%
CURRENTLY MARRIED
1.1/ 100
METRIC RATING
234th/ 347
METRIC RANK
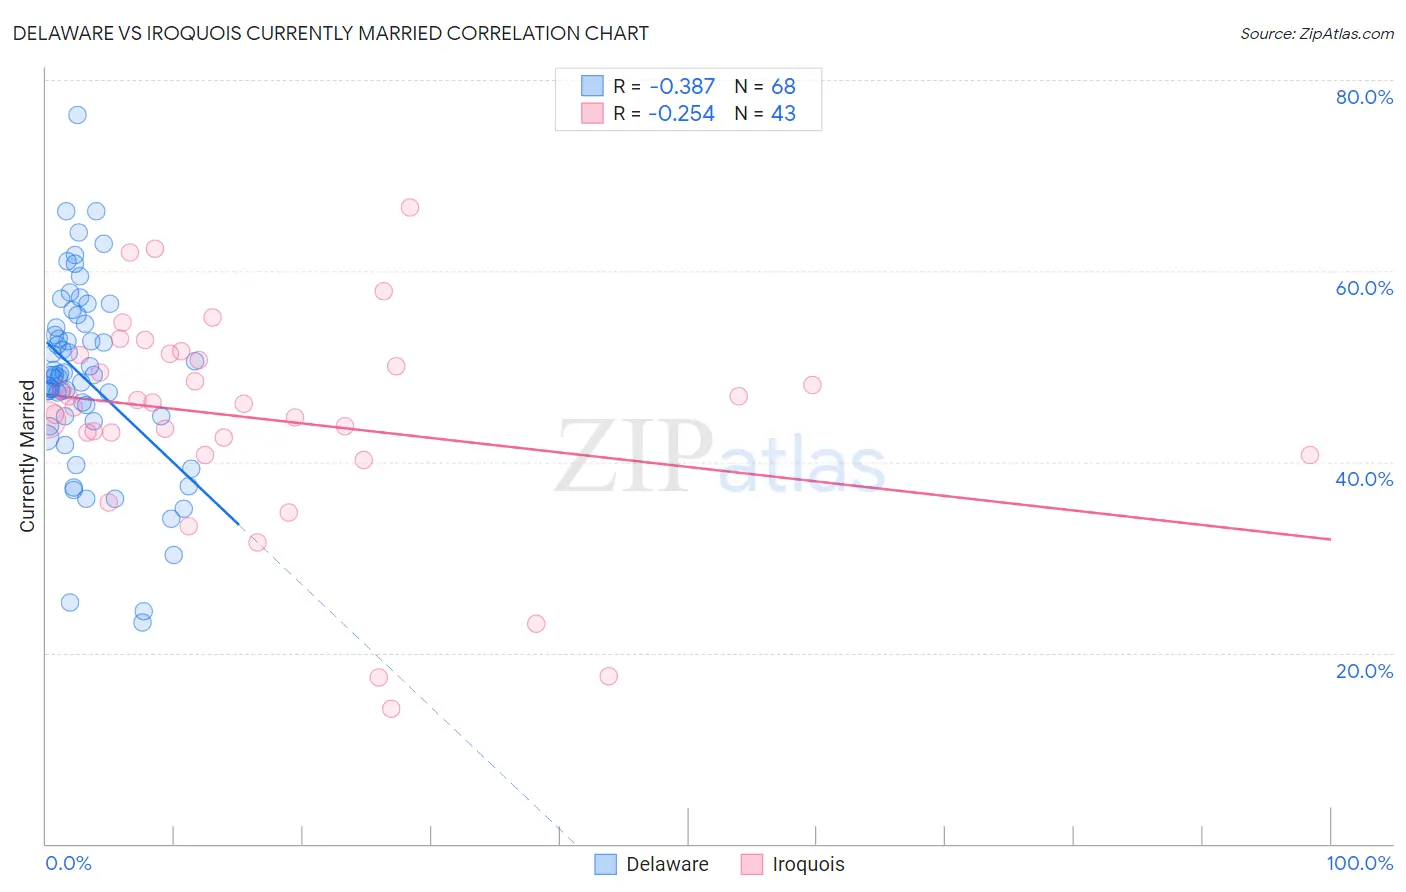
Delaware vs Iroquois Currently Married Correlation Chart
The statistical analysis conducted on geographies consisting of 96,237,198 people shows a mild negative correlation between the proportion of Delaware and percentage of population currently married in the United States with a correlation coefficient (R) of -0.387 and weighted average of 46.9%. Similarly, the statistical analysis conducted on geographies consisting of 207,297,556 people shows a weak negative correlation between the proportion of Iroquois and percentage of population currently married in the United States with a correlation coefficient (R) of -0.254 and weighted average of 44.7%, a difference of 4.9%.
Currently Married Correlation Summary
| Measurement | Delaware | Iroquois |
| Minimum | 23.2% | 14.1% |
| Maximum | 76.3% | 66.7% |
| Range | 53.1% | 52.6% |
| Mean | 48.7% | 44.5% |
| Median | 49.1% | 46.1% |
| Interquartile 25% (IQ1) | 44.5% | 40.7% |
| Interquartile 75% (IQ3) | 54.2% | 51.2% |
| Interquartile Range (IQR) | 9.7% | 10.5% |
| Standard Deviation (Sample) | 9.9% | 11.2% |
| Standard Deviation (Population) | 9.9% | 11.1% |
Similar Demographics by Currently Married
Demographics Similar to Delaware by Currently Married
In terms of currently married, the demographic groups most similar to Delaware are Immigrants from Western Asia (46.9%, a difference of 0.020%), Nonimmigrants (46.9%, a difference of 0.030%), Immigrants from Uzbekistan (46.9%, a difference of 0.050%), Immigrants from Southern Europe (46.9%, a difference of 0.050%), and Iraqi (46.9%, a difference of 0.070%).
| Demographics | Rating | Rank | Currently Married |
| Spanish | 68.1 /100 | #156 | Good 47.0% |
| Immigrants | Switzerland | 67.8 /100 | #157 | Good 46.9% |
| Cherokee | 66.8 /100 | #158 | Good 46.9% |
| Iraqis | 66.4 /100 | #159 | Good 46.9% |
| Immigrants | Uzbekistan | 66.0 /100 | #160 | Good 46.9% |
| Immigrants | Southern Europe | 65.9 /100 | #161 | Good 46.9% |
| Immigrants | Nonimmigrants | 65.4 /100 | #162 | Good 46.9% |
| Delaware | 64.7 /100 | #163 | Good 46.9% |
| Immigrants | Western Asia | 64.2 /100 | #164 | Good 46.9% |
| Samoans | 59.8 /100 | #165 | Average 46.8% |
| Immigrants | Syria | 59.3 /100 | #166 | Average 46.8% |
| Spaniards | 58.8 /100 | #167 | Average 46.8% |
| Immigrants | Afghanistan | 58.2 /100 | #168 | Average 46.8% |
| Armenians | 58.2 /100 | #169 | Average 46.8% |
| Immigrants | Latvia | 56.7 /100 | #170 | Average 46.7% |
Demographics Similar to Iroquois by Currently Married
In terms of currently married, the demographic groups most similar to Iroquois are Immigrants from Saudi Arabia (44.7%, a difference of 0.010%), Nepalese (44.7%, a difference of 0.060%), Alaskan Athabascan (44.6%, a difference of 0.16%), Cuban (44.6%, a difference of 0.16%), and Seminole (44.6%, a difference of 0.17%).
| Demographics | Rating | Rank | Currently Married |
| Spanish Americans | 2.1 /100 | #227 | Tragic 45.0% |
| Immigrants | Uruguay | 2.0 /100 | #228 | Tragic 45.0% |
| Cree | 1.7 /100 | #229 | Tragic 44.9% |
| Immigrants | Kenya | 1.6 /100 | #230 | Tragic 44.9% |
| Immigrants | Panama | 1.5 /100 | #231 | Tragic 44.9% |
| Nepalese | 1.2 /100 | #232 | Tragic 44.7% |
| Immigrants | Saudi Arabia | 1.1 /100 | #233 | Tragic 44.7% |
| Iroquois | 1.1 /100 | #234 | Tragic 44.7% |
| Alaskan Athabascans | 0.9 /100 | #235 | Tragic 44.6% |
| Cubans | 0.9 /100 | #236 | Tragic 44.6% |
| Seminole | 0.9 /100 | #237 | Tragic 44.6% |
| Moroccans | 0.9 /100 | #238 | Tragic 44.6% |
| Immigrants | Mexico | 0.7 /100 | #239 | Tragic 44.5% |
| Mexican American Indians | 0.7 /100 | #240 | Tragic 44.5% |
| Ethiopians | 0.7 /100 | #241 | Tragic 44.5% |