Macedonian vs Indonesian Currently Married
COMPARE
Macedonian
Indonesian
Currently Married
Currently Married Comparison
Macedonians
Indonesians
48.3%
CURRENTLY MARRIED
97.9/ 100
METRIC RATING
71st/ 347
METRIC RANK
43.5%
CURRENTLY MARRIED
0.1/ 100
METRIC RATING
272nd/ 347
METRIC RANK
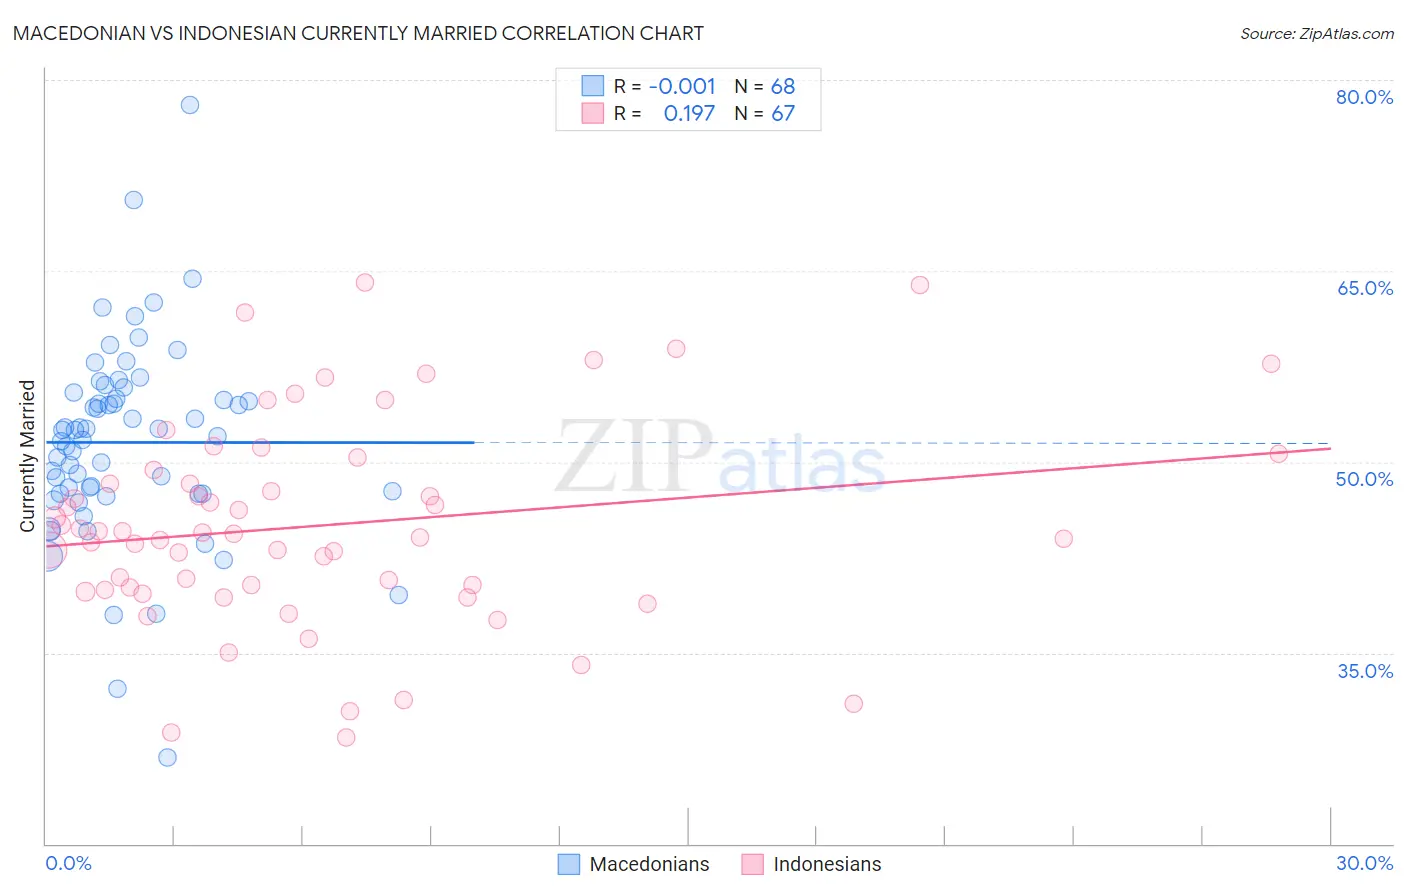
Macedonian vs Indonesian Currently Married Correlation Chart
The statistical analysis conducted on geographies consisting of 132,654,492 people shows no correlation between the proportion of Macedonians and percentage of population currently married in the United States with a correlation coefficient (R) of -0.001 and weighted average of 48.3%. Similarly, the statistical analysis conducted on geographies consisting of 162,724,785 people shows a poor positive correlation between the proportion of Indonesians and percentage of population currently married in the United States with a correlation coefficient (R) of 0.197 and weighted average of 43.5%, a difference of 11.1%.
Currently Married Correlation Summary
| Measurement | Macedonian | Indonesian |
| Minimum | 26.8% | 28.3% |
| Maximum | 78.0% | 64.1% |
| Range | 51.2% | 35.8% |
| Mean | 51.5% | 45.0% |
| Median | 52.3% | 44.3% |
| Interquartile 25% (IQ1) | 47.5% | 39.9% |
| Interquartile 75% (IQ3) | 55.2% | 49.4% |
| Interquartile Range (IQR) | 7.7% | 9.4% |
| Standard Deviation (Sample) | 7.9% | 8.1% |
| Standard Deviation (Population) | 7.8% | 8.0% |
Similar Demographics by Currently Married
Demographics Similar to Macedonians by Currently Married
In terms of currently married, the demographic groups most similar to Macedonians are Immigrants from Asia (48.3%, a difference of 0.010%), Canadian (48.3%, a difference of 0.090%), Immigrants from England (48.3%, a difference of 0.11%), Slovak (48.3%, a difference of 0.12%), and Tongan (48.3%, a difference of 0.13%).
| Demographics | Rating | Rank | Currently Married |
| Immigrants | Czechoslovakia | 98.3 /100 | #64 | Exceptional 48.4% |
| Ukrainians | 98.3 /100 | #65 | Exceptional 48.4% |
| Tongans | 98.2 /100 | #66 | Exceptional 48.3% |
| Slovaks | 98.2 /100 | #67 | Exceptional 48.3% |
| Immigrants | England | 98.2 /100 | #68 | Exceptional 48.3% |
| Canadians | 98.1 /100 | #69 | Exceptional 48.3% |
| Immigrants | Asia | 97.9 /100 | #70 | Exceptional 48.3% |
| Macedonians | 97.9 /100 | #71 | Exceptional 48.3% |
| Immigrants | Lebanon | 97.6 /100 | #72 | Exceptional 48.2% |
| Immigrants | Eastern Asia | 97.5 /100 | #73 | Exceptional 48.2% |
| Estonians | 97.4 /100 | #74 | Exceptional 48.2% |
| Immigrants | Belarus | 97.2 /100 | #75 | Exceptional 48.1% |
| Basques | 97.2 /100 | #76 | Exceptional 48.1% |
| Slovenes | 97.1 /100 | #77 | Exceptional 48.1% |
| Immigrants | Belgium | 97.1 /100 | #78 | Exceptional 48.1% |
Demographics Similar to Indonesians by Currently Married
In terms of currently married, the demographic groups most similar to Indonesians are Bermudan (43.5%, a difference of 0.040%), Yaqui (43.4%, a difference of 0.040%), Salvadoran (43.5%, a difference of 0.050%), Nigerian (43.4%, a difference of 0.060%), and Colville (43.4%, a difference of 0.080%).
| Demographics | Rating | Rank | Currently Married |
| Immigrants | Bangladesh | 0.1 /100 | #265 | Tragic 43.6% |
| Ecuadorians | 0.1 /100 | #266 | Tragic 43.6% |
| Immigrants | Eritrea | 0.1 /100 | #267 | Tragic 43.6% |
| Spanish American Indians | 0.1 /100 | #268 | Tragic 43.6% |
| Immigrants | Sudan | 0.1 /100 | #269 | Tragic 43.5% |
| Salvadorans | 0.1 /100 | #270 | Tragic 43.5% |
| Bermudans | 0.1 /100 | #271 | Tragic 43.5% |
| Indonesians | 0.1 /100 | #272 | Tragic 43.5% |
| Yaqui | 0.1 /100 | #273 | Tragic 43.4% |
| Nigerians | 0.1 /100 | #274 | Tragic 43.4% |
| Colville | 0.1 /100 | #275 | Tragic 43.4% |
| Sierra Leoneans | 0.1 /100 | #276 | Tragic 43.4% |
| Immigrants | Nigeria | 0.1 /100 | #277 | Tragic 43.4% |
| Central Americans | 0.0 /100 | #278 | Tragic 43.3% |
| Central American Indians | 0.0 /100 | #279 | Tragic 43.3% |