Delaware vs Dominican Family Households
COMPARE
Delaware
Dominican
Family Households
Family Households Comparison
Delaware
Dominicans
64.6%
FAMILY HOUSEHOLDS
76.3/ 100
METRIC RATING
148th/ 347
METRIC RANK
63.4%
FAMILY HOUSEHOLDS
1.5/ 100
METRIC RATING
248th/ 347
METRIC RANK
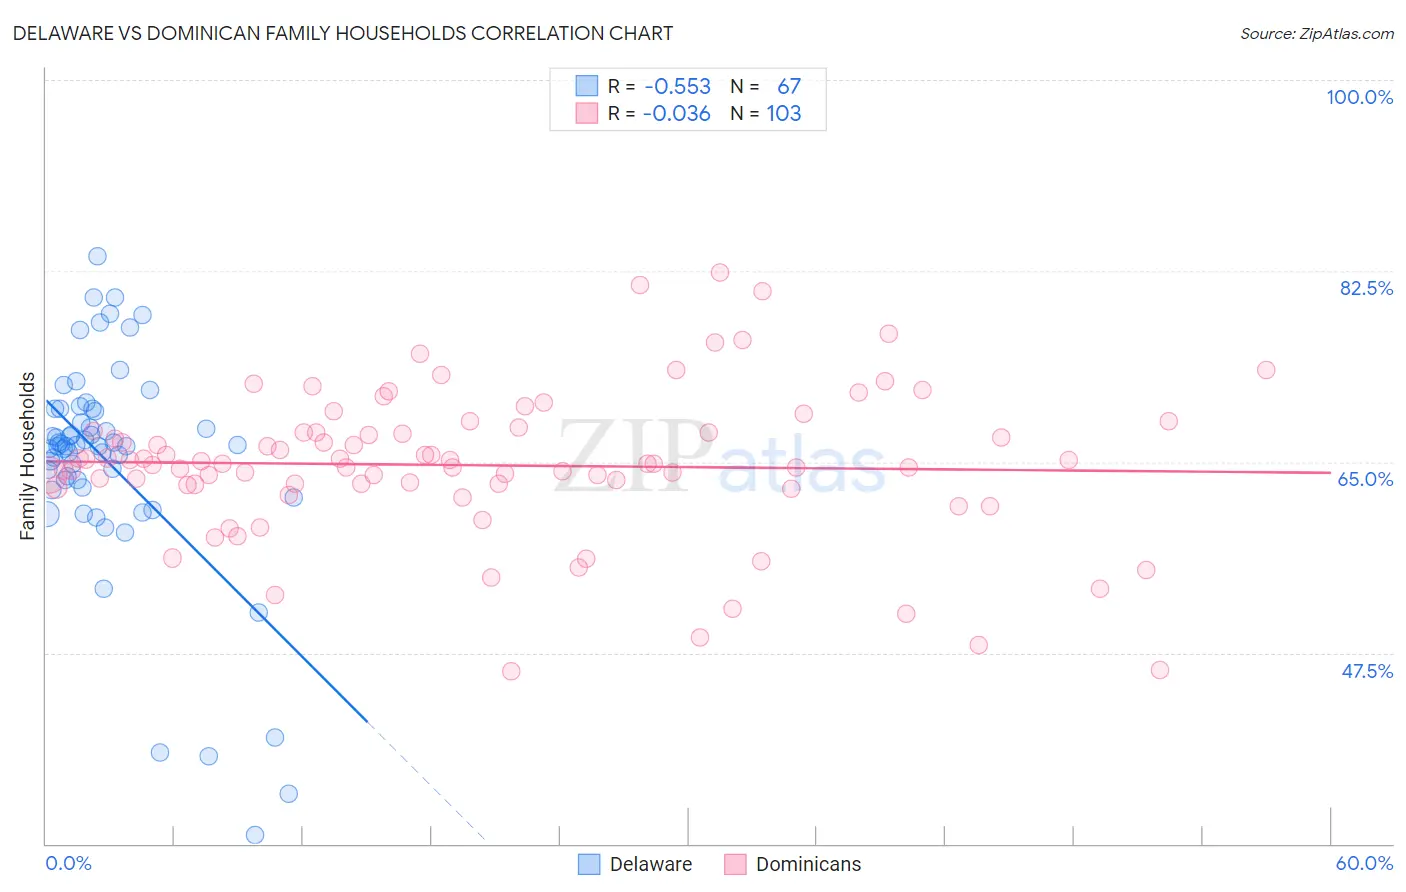
Delaware vs Dominican Family Households Correlation Chart
The statistical analysis conducted on geographies consisting of 96,227,636 people shows a substantial negative correlation between the proportion of Delaware and percentage of family households in the United States with a correlation coefficient (R) of -0.553 and weighted average of 64.6%. Similarly, the statistical analysis conducted on geographies consisting of 354,767,002 people shows no correlation between the proportion of Dominicans and percentage of family households in the United States with a correlation coefficient (R) of -0.036 and weighted average of 63.4%, a difference of 1.8%.
Family Households Correlation Summary
| Measurement | Delaware | Dominican |
| Minimum | 30.8% | 45.8% |
| Maximum | 83.8% | 82.4% |
| Range | 53.1% | 36.6% |
| Mean | 65.0% | 64.7% |
| Median | 66.5% | 64.9% |
| Interquartile 25% (IQ1) | 62.6% | 62.9% |
| Interquartile 75% (IQ3) | 69.9% | 67.7% |
| Interquartile Range (IQR) | 7.2% | 4.8% |
| Standard Deviation (Sample) | 10.2% | 6.8% |
| Standard Deviation (Population) | 10.1% | 6.8% |
Similar Demographics by Family Households
Demographics Similar to Delaware by Family Households
In terms of family households, the demographic groups most similar to Delaware are Immigrants from Chile (64.6%, a difference of 0.0%), Sioux (64.6%, a difference of 0.0%), Immigrants from Romania (64.6%, a difference of 0.010%), Romanian (64.5%, a difference of 0.020%), and Syrian (64.5%, a difference of 0.020%).
| Demographics | Rating | Rank | Family Households |
| Immigrants | Cameroon | 84.8 /100 | #141 | Excellent 64.7% |
| Pakistanis | 84.0 /100 | #142 | Excellent 64.7% |
| Czechoslovakians | 82.1 /100 | #143 | Excellent 64.6% |
| South American Indians | 81.9 /100 | #144 | Excellent 64.6% |
| Welsh | 80.1 /100 | #145 | Excellent 64.6% |
| Immigrants | Romania | 77.0 /100 | #146 | Good 64.6% |
| Immigrants | Chile | 76.5 /100 | #147 | Good 64.6% |
| Delaware | 76.3 /100 | #148 | Good 64.6% |
| Sioux | 76.3 /100 | #149 | Good 64.6% |
| Romanians | 75.3 /100 | #150 | Good 64.5% |
| Syrians | 75.2 /100 | #151 | Good 64.5% |
| Scottish | 70.9 /100 | #152 | Good 64.5% |
| Swedes | 69.8 /100 | #153 | Good 64.5% |
| Austrians | 68.5 /100 | #154 | Good 64.5% |
| Uruguayans | 67.7 /100 | #155 | Good 64.5% |
Demographics Similar to Dominicans by Family Households
In terms of family households, the demographic groups most similar to Dominicans are Immigrants from Uzbekistan (63.4%, a difference of 0.010%), Russian (63.4%, a difference of 0.010%), Immigrants from Ghana (63.4%, a difference of 0.020%), Immigrants from Japan (63.4%, a difference of 0.030%), and Eastern European (63.4%, a difference of 0.040%).
| Demographics | Rating | Rank | Family Households |
| Immigrants | St. Vincent and the Grenadines | 1.9 /100 | #241 | Tragic 63.4% |
| Immigrants | Israel | 1.8 /100 | #242 | Tragic 63.4% |
| Immigrants | Czechoslovakia | 1.8 /100 | #243 | Tragic 63.4% |
| Eastern Europeans | 1.6 /100 | #244 | Tragic 63.4% |
| Immigrants | Dominica | 1.6 /100 | #245 | Tragic 63.4% |
| Immigrants | Ghana | 1.6 /100 | #246 | Tragic 63.4% |
| Immigrants | Uzbekistan | 1.5 /100 | #247 | Tragic 63.4% |
| Dominicans | 1.5 /100 | #248 | Tragic 63.4% |
| Russians | 1.4 /100 | #249 | Tragic 63.4% |
| Immigrants | Japan | 1.4 /100 | #250 | Tragic 63.4% |
| Taiwanese | 1.2 /100 | #251 | Tragic 63.3% |
| Bahamians | 1.1 /100 | #252 | Tragic 63.3% |
| Immigrants | Dominican Republic | 1.0 /100 | #253 | Tragic 63.3% |
| Slovaks | 1.0 /100 | #254 | Tragic 63.3% |
| Potawatomi | 1.0 /100 | #255 | Tragic 63.3% |