Delaware vs Bhutanese Family Households
COMPARE
Delaware
Bhutanese
Family Households
Family Households Comparison
Delaware
Bhutanese
64.6%
FAMILY HOUSEHOLDS
76.3/ 100
METRIC RATING
148th/ 347
METRIC RANK
65.9%
FAMILY HOUSEHOLDS
99.9/ 100
METRIC RATING
71st/ 347
METRIC RANK
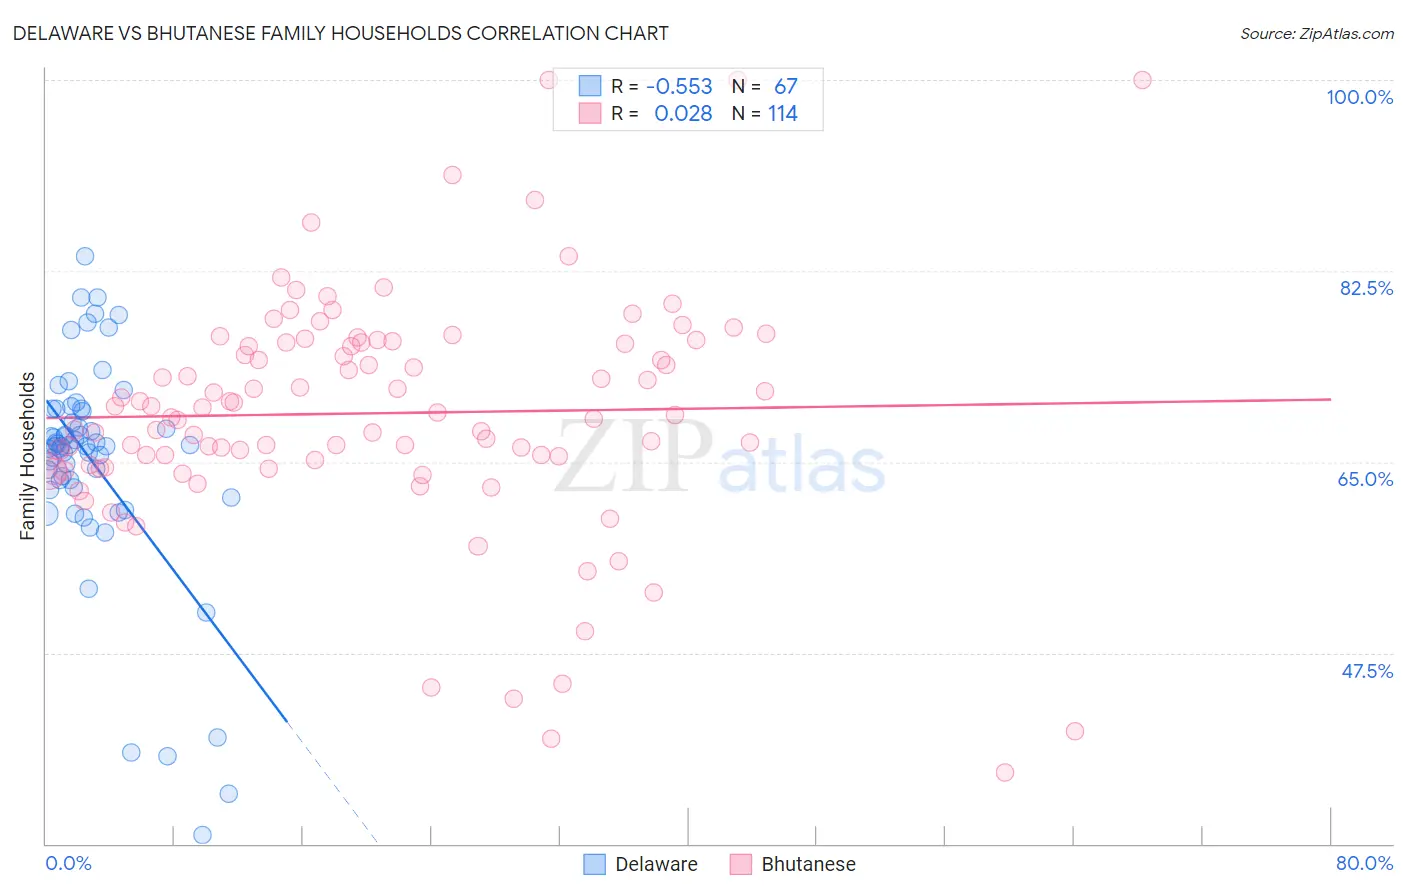
Delaware vs Bhutanese Family Households Correlation Chart
The statistical analysis conducted on geographies consisting of 96,227,636 people shows a substantial negative correlation between the proportion of Delaware and percentage of family households in the United States with a correlation coefficient (R) of -0.553 and weighted average of 64.6%. Similarly, the statistical analysis conducted on geographies consisting of 455,147,880 people shows no correlation between the proportion of Bhutanese and percentage of family households in the United States with a correlation coefficient (R) of 0.028 and weighted average of 65.9%, a difference of 2.0%.
Family Households Correlation Summary
| Measurement | Delaware | Bhutanese |
| Minimum | 30.8% | 36.6% |
| Maximum | 83.8% | 100.0% |
| Range | 53.1% | 63.4% |
| Mean | 65.0% | 69.5% |
| Median | 66.5% | 69.4% |
| Interquartile 25% (IQ1) | 62.6% | 64.7% |
| Interquartile 75% (IQ3) | 69.9% | 75.9% |
| Interquartile Range (IQR) | 7.2% | 11.2% |
| Standard Deviation (Sample) | 10.2% | 10.8% |
| Standard Deviation (Population) | 10.1% | 10.8% |
Similar Demographics by Family Households
Demographics Similar to Delaware by Family Households
In terms of family households, the demographic groups most similar to Delaware are Immigrants from Chile (64.6%, a difference of 0.0%), Sioux (64.6%, a difference of 0.0%), Immigrants from Romania (64.6%, a difference of 0.010%), Romanian (64.5%, a difference of 0.020%), and Syrian (64.5%, a difference of 0.020%).
| Demographics | Rating | Rank | Family Households |
| Immigrants | Cameroon | 84.8 /100 | #141 | Excellent 64.7% |
| Pakistanis | 84.0 /100 | #142 | Excellent 64.7% |
| Czechoslovakians | 82.1 /100 | #143 | Excellent 64.6% |
| South American Indians | 81.9 /100 | #144 | Excellent 64.6% |
| Welsh | 80.1 /100 | #145 | Excellent 64.6% |
| Immigrants | Romania | 77.0 /100 | #146 | Good 64.6% |
| Immigrants | Chile | 76.5 /100 | #147 | Good 64.6% |
| Delaware | 76.3 /100 | #148 | Good 64.6% |
| Sioux | 76.3 /100 | #149 | Good 64.6% |
| Romanians | 75.3 /100 | #150 | Good 64.5% |
| Syrians | 75.2 /100 | #151 | Good 64.5% |
| Scottish | 70.9 /100 | #152 | Good 64.5% |
| Swedes | 69.8 /100 | #153 | Good 64.5% |
| Austrians | 68.5 /100 | #154 | Good 64.5% |
| Uruguayans | 67.7 /100 | #155 | Good 64.5% |
Demographics Similar to Bhutanese by Family Households
In terms of family households, the demographic groups most similar to Bhutanese are Malaysian (65.9%, a difference of 0.020%), Immigrants from Afghanistan (65.9%, a difference of 0.020%), Portuguese (65.8%, a difference of 0.050%), Japanese (65.9%, a difference of 0.060%), and Fijian (65.9%, a difference of 0.080%).
| Demographics | Rating | Rank | Family Households |
| Pima | 99.9 /100 | #64 | Exceptional 65.9% |
| Costa Ricans | 99.9 /100 | #65 | Exceptional 65.9% |
| Fijians | 99.9 /100 | #66 | Exceptional 65.9% |
| Filipinos | 99.9 /100 | #67 | Exceptional 65.9% |
| Japanese | 99.9 /100 | #68 | Exceptional 65.9% |
| Malaysians | 99.9 /100 | #69 | Exceptional 65.9% |
| Immigrants | Afghanistan | 99.9 /100 | #70 | Exceptional 65.9% |
| Bhutanese | 99.9 /100 | #71 | Exceptional 65.9% |
| Portuguese | 99.9 /100 | #72 | Exceptional 65.8% |
| Laotians | 99.9 /100 | #73 | Exceptional 65.8% |
| Burmese | 99.9 /100 | #74 | Exceptional 65.7% |
| Houma | 99.9 /100 | #75 | Exceptional 65.7% |
| Immigrants | Azores | 99.8 /100 | #76 | Exceptional 65.6% |
| Immigrants | South America | 99.8 /100 | #77 | Exceptional 65.6% |
| Yaqui | 99.8 /100 | #78 | Exceptional 65.6% |