Puget Sound Salish vs Central American Average Family Size
COMPARE
Puget Sound Salish
Central American
Average Family Size
Average Family Size Comparison
Puget Sound Salish
Central Americans
3.17
AVERAGE FAMILY SIZE
1.9/ 100
METRIC RATING
250th/ 347
METRIC RANK
3.41
AVERAGE FAMILY SIZE
100.0/ 100
METRIC RATING
31st/ 347
METRIC RANK
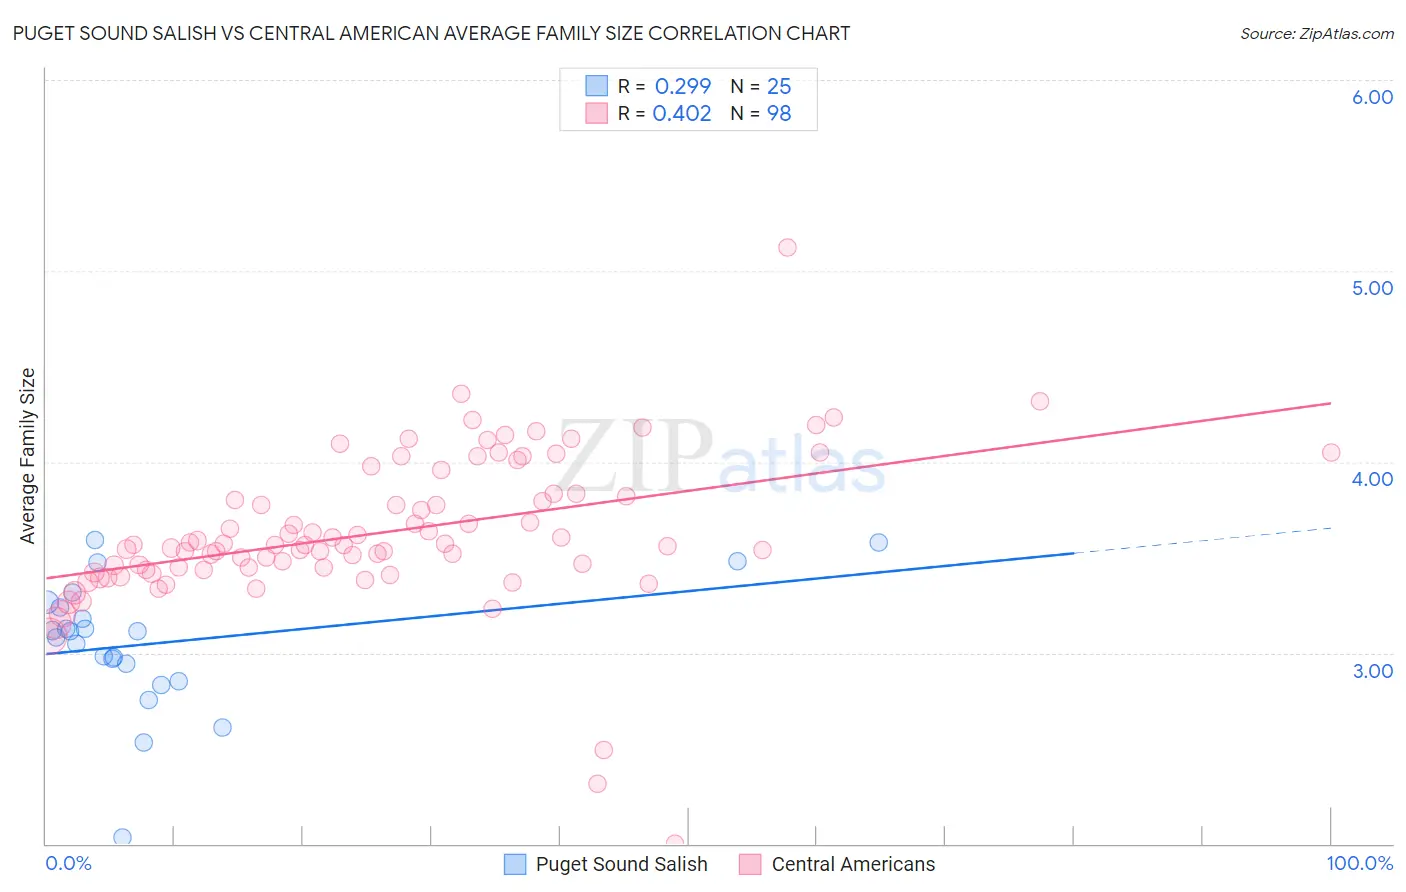
Puget Sound Salish vs Central American Average Family Size Correlation Chart
The statistical analysis conducted on geographies consisting of 46,155,775 people shows a weak positive correlation between the proportion of Puget Sound Salish and average family size in the United States with a correlation coefficient (R) of 0.299 and weighted average of 3.17. Similarly, the statistical analysis conducted on geographies consisting of 504,084,527 people shows a moderate positive correlation between the proportion of Central Americans and average family size in the United States with a correlation coefficient (R) of 0.402 and weighted average of 3.41, a difference of 7.7%.
Average Family Size Correlation Summary
| Measurement | Puget Sound Salish | Central American |
| Minimum | 2.03 | 2.00 |
| Maximum | 3.59 | 5.12 |
| Range | 1.56 | 3.12 |
| Mean | 3.05 | 3.63 |
| Median | 3.11 | 3.56 |
| Interquartile 25% (IQ1) | 2.90 | 3.43 |
| Interquartile 75% (IQ3) | 3.25 | 3.83 |
| Interquartile Range (IQR) | 0.36 | 0.40 |
| Standard Deviation (Sample) | 0.34 | 0.41 |
| Standard Deviation (Population) | 0.34 | 0.40 |
Similar Demographics by Average Family Size
Demographics Similar to Puget Sound Salish by Average Family Size
In terms of average family size, the demographic groups most similar to Puget Sound Salish are Immigrants from Spain (3.17, a difference of 0.010%), Immigrants from Saudi Arabia (3.17, a difference of 0.040%), South African (3.17, a difference of 0.040%), Immigrants from Hungary (3.17, a difference of 0.050%), and Immigrants from Eastern Europe (3.17, a difference of 0.060%).
| Demographics | Rating | Rank | Average Family Size |
| Immigrants | Moldova | 2.9 /100 | #243 | Tragic 3.18 |
| Immigrants | Southern Europe | 2.9 /100 | #244 | Tragic 3.18 |
| Immigrants | Brazil | 2.7 /100 | #245 | Tragic 3.18 |
| Danes | 2.5 /100 | #246 | Tragic 3.17 |
| Cajuns | 2.4 /100 | #247 | Tragic 3.17 |
| Immigrants | Belarus | 2.3 /100 | #248 | Tragic 3.17 |
| Immigrants | Eastern Europe | 2.1 /100 | #249 | Tragic 3.17 |
| Puget Sound Salish | 1.9 /100 | #250 | Tragic 3.17 |
| Immigrants | Spain | 1.8 /100 | #251 | Tragic 3.17 |
| Immigrants | Saudi Arabia | 1.7 /100 | #252 | Tragic 3.17 |
| South Africans | 1.7 /100 | #253 | Tragic 3.17 |
| Immigrants | Hungary | 1.7 /100 | #254 | Tragic 3.17 |
| Cape Verdeans | 1.6 /100 | #255 | Tragic 3.17 |
| Immigrants | Kazakhstan | 1.5 /100 | #256 | Tragic 3.17 |
| Albanians | 1.5 /100 | #257 | Tragic 3.17 |
Demographics Similar to Central Americans by Average Family Size
In terms of average family size, the demographic groups most similar to Central Americans are Immigrants from Guatemala (3.41, a difference of 0.10%), Hawaiian (3.41, a difference of 0.12%), Hispanic or Latino (3.41, a difference of 0.18%), Samoan (3.42, a difference of 0.20%), and Nepalese (3.42, a difference of 0.23%).
| Demographics | Rating | Rank | Average Family Size |
| Natives/Alaskans | 100.0 /100 | #24 | Exceptional 3.45 |
| Yakama | 100.0 /100 | #25 | Exceptional 3.45 |
| Native Hawaiians | 100.0 /100 | #26 | Exceptional 3.43 |
| Mexican American Indians | 100.0 /100 | #27 | Exceptional 3.43 |
| Immigrants | Latin America | 100.0 /100 | #28 | Exceptional 3.42 |
| Nepalese | 100.0 /100 | #29 | Exceptional 3.42 |
| Samoans | 100.0 /100 | #30 | Exceptional 3.42 |
| Central Americans | 100.0 /100 | #31 | Exceptional 3.41 |
| Immigrants | Guatemala | 100.0 /100 | #32 | Exceptional 3.41 |
| Hawaiians | 100.0 /100 | #33 | Exceptional 3.41 |
| Hispanics or Latinos | 100.0 /100 | #34 | Exceptional 3.41 |
| Guatemalans | 100.0 /100 | #35 | Exceptional 3.40 |
| Immigrants | Guyana | 100.0 /100 | #36 | Exceptional 3.40 |
| Guyanese | 100.0 /100 | #37 | Exceptional 3.40 |
| Immigrants | Belize | 100.0 /100 | #38 | Exceptional 3.39 |