Czech vs Immigrants from Pakistan Currently Married
COMPARE
Czech
Immigrants from Pakistan
Currently Married
Currently Married Comparison
Czechs
Immigrants from Pakistan
49.9%
CURRENTLY MARRIED
99.9/ 100
METRIC RATING
9th/ 347
METRIC RANK
49.1%
CURRENTLY MARRIED
99.7/ 100
METRIC RATING
23rd/ 347
METRIC RANK
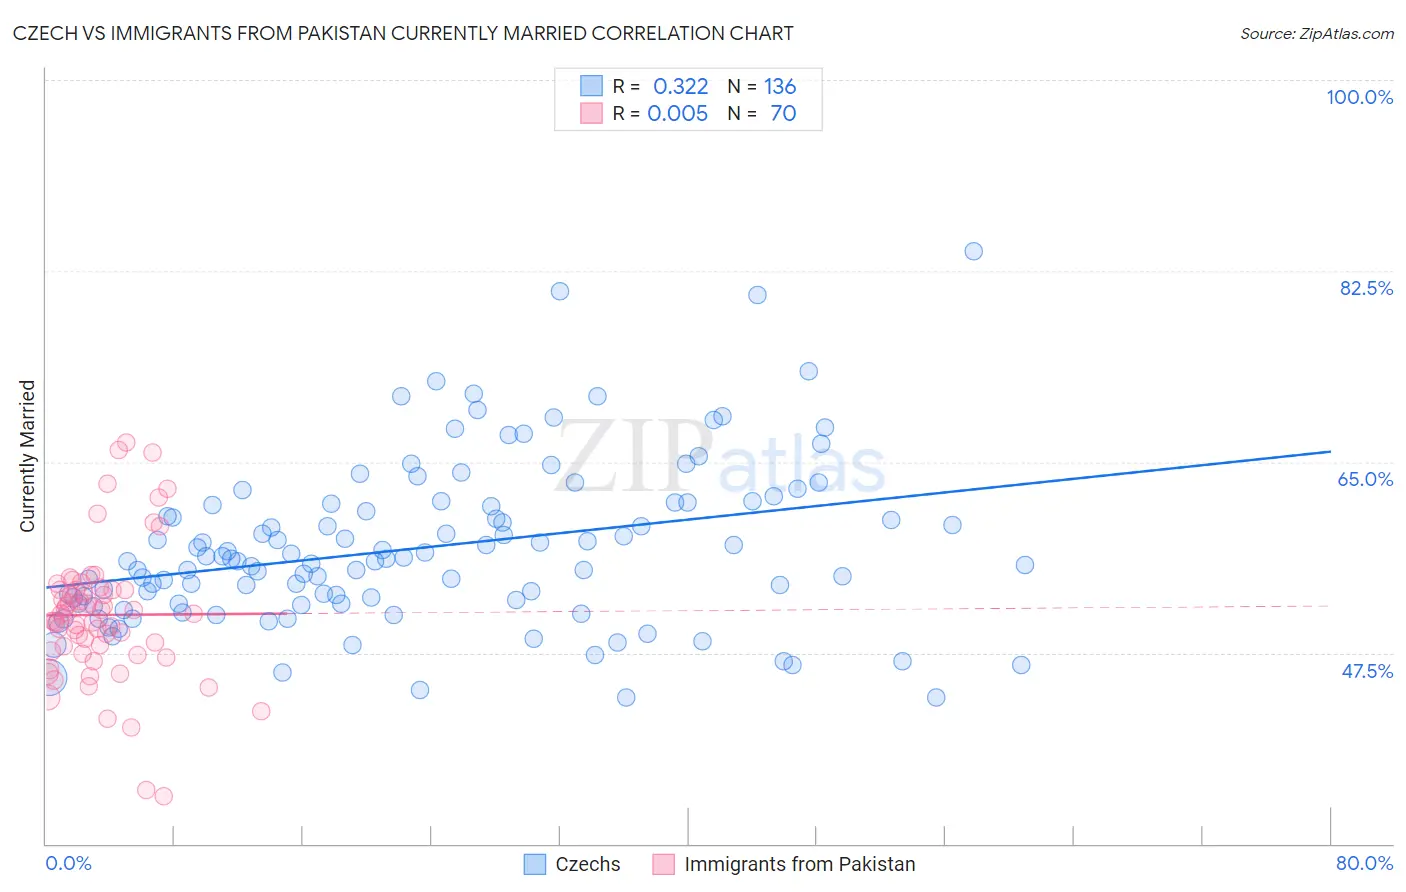
Czech vs Immigrants from Pakistan Currently Married Correlation Chart
The statistical analysis conducted on geographies consisting of 484,743,369 people shows a mild positive correlation between the proportion of Czechs and percentage of population currently married in the United States with a correlation coefficient (R) of 0.322 and weighted average of 49.9%. Similarly, the statistical analysis conducted on geographies consisting of 283,886,869 people shows no correlation between the proportion of Immigrants from Pakistan and percentage of population currently married in the United States with a correlation coefficient (R) of 0.005 and weighted average of 49.1%, a difference of 1.6%.
Currently Married Correlation Summary
| Measurement | Czech | Immigrants from Pakistan |
| Minimum | 43.4% | 34.4% |
| Maximum | 84.3% | 66.7% |
| Range | 40.9% | 32.3% |
| Mean | 57.1% | 51.0% |
| Median | 56.0% | 51.1% |
| Interquartile 25% (IQ1) | 52.0% | 47.6% |
| Interquartile 75% (IQ3) | 61.1% | 53.3% |
| Interquartile Range (IQR) | 9.1% | 5.7% |
| Standard Deviation (Sample) | 7.5% | 6.2% |
| Standard Deviation (Population) | 7.5% | 6.1% |
Demographics Similar to Czechs and Immigrants from Pakistan by Currently Married
In terms of currently married, the demographic groups most similar to Czechs are Swedish (50.0%, a difference of 0.19%), Filipino (49.7%, a difference of 0.26%), English (49.7%, a difference of 0.27%), Swiss (49.7%, a difference of 0.27%), and Immigrants from South Central Asia (50.0%, a difference of 0.32%). Similarly, the demographic groups most similar to Immigrants from Pakistan are Bulgarian (49.1%, a difference of 0.11%), Lithuanian (49.0%, a difference of 0.11%), Maltese (49.0%, a difference of 0.12%), Immigrants from Korea (49.0%, a difference of 0.17%), and Scottish (49.2%, a difference of 0.33%).
| Demographics | Rating | Rank | Currently Married |
| Norwegians | 100.0 /100 | #6 | Exceptional 50.2% |
| Immigrants | South Central Asia | 100.0 /100 | #7 | Exceptional 50.0% |
| Swedes | 100.0 /100 | #8 | Exceptional 50.0% |
| Czechs | 99.9 /100 | #9 | Exceptional 49.9% |
| Filipinos | 99.9 /100 | #10 | Exceptional 49.7% |
| English | 99.9 /100 | #11 | Exceptional 49.7% |
| Swiss | 99.9 /100 | #12 | Exceptional 49.7% |
| Dutch | 99.9 /100 | #13 | Exceptional 49.6% |
| Germans | 99.9 /100 | #14 | Exceptional 49.6% |
| Pennsylvania Germans | 99.9 /100 | #15 | Exceptional 49.6% |
| Chinese | 99.9 /100 | #16 | Exceptional 49.5% |
| Scandinavians | 99.9 /100 | #17 | Exceptional 49.5% |
| Immigrants | Scotland | 99.8 /100 | #18 | Exceptional 49.3% |
| Europeans | 99.8 /100 | #19 | Exceptional 49.3% |
| Luxembourgers | 99.8 /100 | #20 | Exceptional 49.3% |
| Scottish | 99.8 /100 | #21 | Exceptional 49.2% |
| Bulgarians | 99.7 /100 | #22 | Exceptional 49.1% |
| Immigrants | Pakistan | 99.7 /100 | #23 | Exceptional 49.1% |
| Lithuanians | 99.6 /100 | #24 | Exceptional 49.0% |
| Maltese | 99.6 /100 | #25 | Exceptional 49.0% |
| Immigrants | Korea | 99.6 /100 | #26 | Exceptional 49.0% |