Czech vs Sierra Leonean Median Male Earnings
COMPARE
Czech
Sierra Leonean
Median Male Earnings
Median Male Earnings Comparison
Czechs
Sierra Leoneans
$56,546
MEDIAN MALE EARNINGS
88.2/ 100
METRIC RATING
132nd/ 347
METRIC RANK
$54,279
MEDIAN MALE EARNINGS
44.8/ 100
METRIC RATING
178th/ 347
METRIC RANK
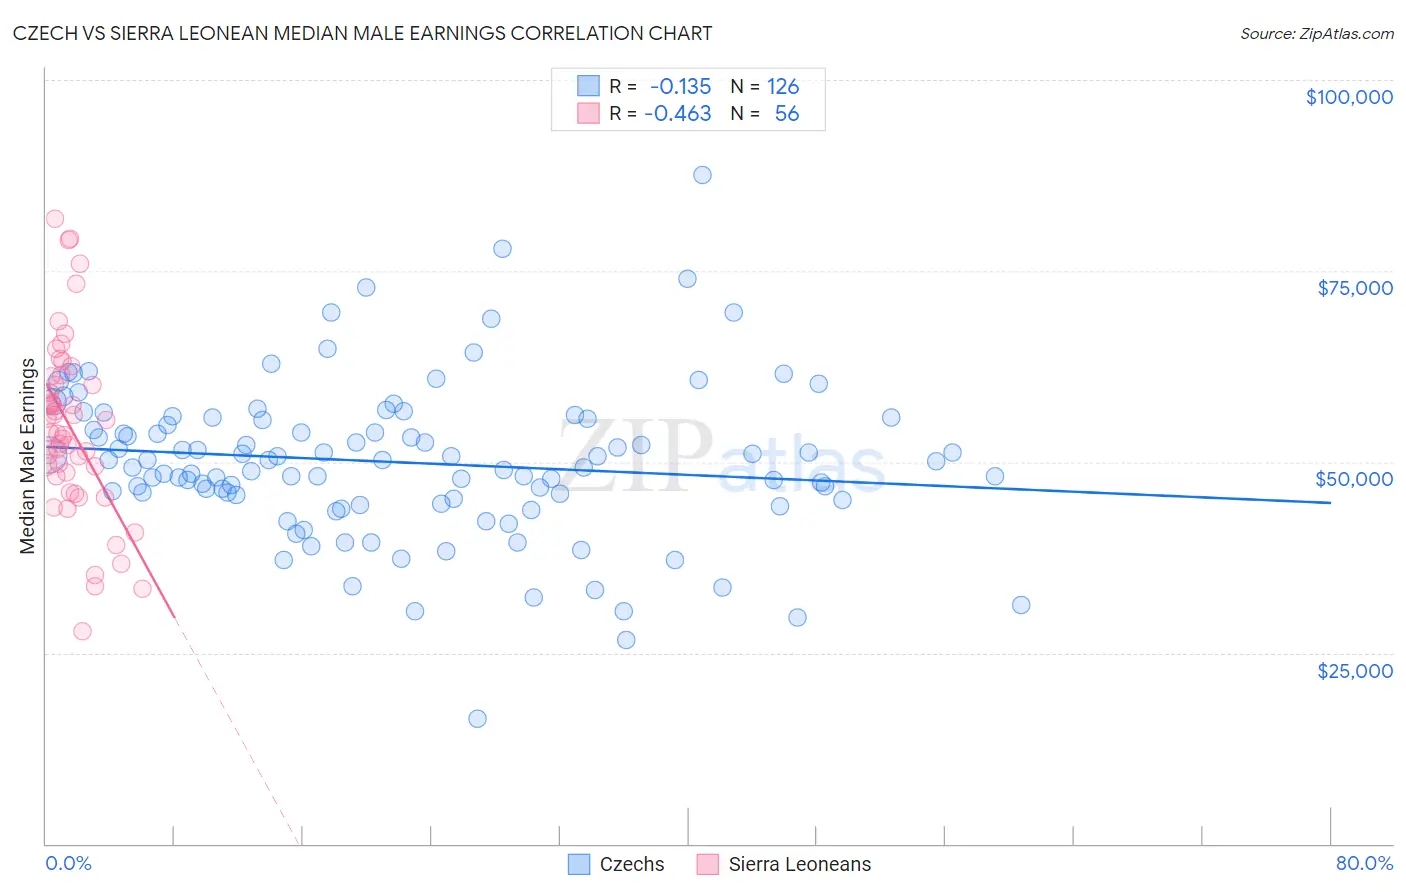
Czech vs Sierra Leonean Median Male Earnings Correlation Chart
The statistical analysis conducted on geographies consisting of 484,464,661 people shows a poor negative correlation between the proportion of Czechs and median male earnings in the United States with a correlation coefficient (R) of -0.135 and weighted average of $56,546. Similarly, the statistical analysis conducted on geographies consisting of 83,343,819 people shows a moderate negative correlation between the proportion of Sierra Leoneans and median male earnings in the United States with a correlation coefficient (R) of -0.463 and weighted average of $54,279, a difference of 4.2%.
Median Male Earnings Correlation Summary
| Measurement | Czech | Sierra Leonean |
| Minimum | $16,298 | $27,751 |
| Maximum | $87,500 | $81,874 |
| Range | $71,202 | $54,123 |
| Mean | $49,947 | $54,478 |
| Median | $50,154 | $53,788 |
| Interquartile 25% (IQ1) | $45,179 | $48,321 |
| Interquartile 75% (IQ3) | $55,641 | $60,630 |
| Interquartile Range (IQR) | $10,462 | $12,308 |
| Standard Deviation (Sample) | $10,298 | $11,493 |
| Standard Deviation (Population) | $10,257 | $11,390 |
Similar Demographics by Median Male Earnings
Demographics Similar to Czechs by Median Male Earnings
In terms of median male earnings, the demographic groups most similar to Czechs are Immigrants from Germany ($56,542, a difference of 0.010%), Moroccan ($56,499, a difference of 0.080%), Irish ($56,464, a difference of 0.14%), Immigrants from Saudi Arabia ($56,452, a difference of 0.17%), and Portuguese ($56,663, a difference of 0.21%).
| Demographics | Rating | Rank | Median Male Earnings |
| Immigrants | Morocco | 91.8 /100 | #125 | Exceptional $56,958 |
| Chinese | 91.1 /100 | #126 | Exceptional $56,872 |
| Brazilians | 90.9 /100 | #127 | Exceptional $56,837 |
| Immigrants | Syria | 90.8 /100 | #128 | Exceptional $56,830 |
| Pakistanis | 89.9 /100 | #129 | Excellent $56,719 |
| Koreans | 89.4 /100 | #130 | Excellent $56,672 |
| Portuguese | 89.4 /100 | #131 | Excellent $56,663 |
| Czechs | 88.2 /100 | #132 | Excellent $56,546 |
| Immigrants | Germany | 88.2 /100 | #133 | Excellent $56,542 |
| Moroccans | 87.7 /100 | #134 | Excellent $56,499 |
| Irish | 87.4 /100 | #135 | Excellent $56,464 |
| Immigrants | Saudi Arabia | 87.2 /100 | #136 | Excellent $56,452 |
| Slavs | 86.5 /100 | #137 | Excellent $56,390 |
| Slovaks | 85.5 /100 | #138 | Excellent $56,306 |
| Zimbabweans | 85.5 /100 | #139 | Excellent $56,302 |
Demographics Similar to Sierra Leoneans by Median Male Earnings
In terms of median male earnings, the demographic groups most similar to Sierra Leoneans are Costa Rican ($54,279, a difference of 0.0%), Celtic ($54,242, a difference of 0.070%), Iraqi ($54,182, a difference of 0.18%), Immigrants ($54,168, a difference of 0.21%), and Spaniard ($54,401, a difference of 0.22%).
| Demographics | Rating | Rank | Median Male Earnings |
| Immigrants | Peru | 54.9 /100 | #171 | Average $54,695 |
| Welsh | 53.8 /100 | #172 | Average $54,647 |
| South American Indians | 50.4 /100 | #173 | Average $54,508 |
| South Americans | 50.0 /100 | #174 | Average $54,492 |
| Dutch | 48.0 /100 | #175 | Average $54,410 |
| Spaniards | 47.8 /100 | #176 | Average $54,401 |
| Costa Ricans | 44.8 /100 | #177 | Average $54,279 |
| Sierra Leoneans | 44.8 /100 | #178 | Average $54,279 |
| Celtics | 43.9 /100 | #179 | Average $54,242 |
| Iraqis | 42.5 /100 | #180 | Average $54,182 |
| Immigrants | Immigrants | 42.1 /100 | #181 | Average $54,168 |
| Yugoslavians | 37.4 /100 | #182 | Fair $53,967 |
| Immigrants | South America | 37.3 /100 | #183 | Fair $53,962 |
| Whites/Caucasians | 36.5 /100 | #184 | Fair $53,925 |
| Immigrants | Sierra Leone | 36.0 /100 | #185 | Fair $53,905 |