Czechoslovakian vs Tsimshian Median Male Earnings
COMPARE
Czechoslovakian
Tsimshian
Median Male Earnings
Median Male Earnings Comparison
Czechoslovakians
Tsimshian
$55,382
MEDIAN MALE EARNINGS
70.5/ 100
METRIC RATING
158th/ 347
METRIC RANK
$48,836
MEDIAN MALE EARNINGS
0.4/ 100
METRIC RATING
269th/ 347
METRIC RANK
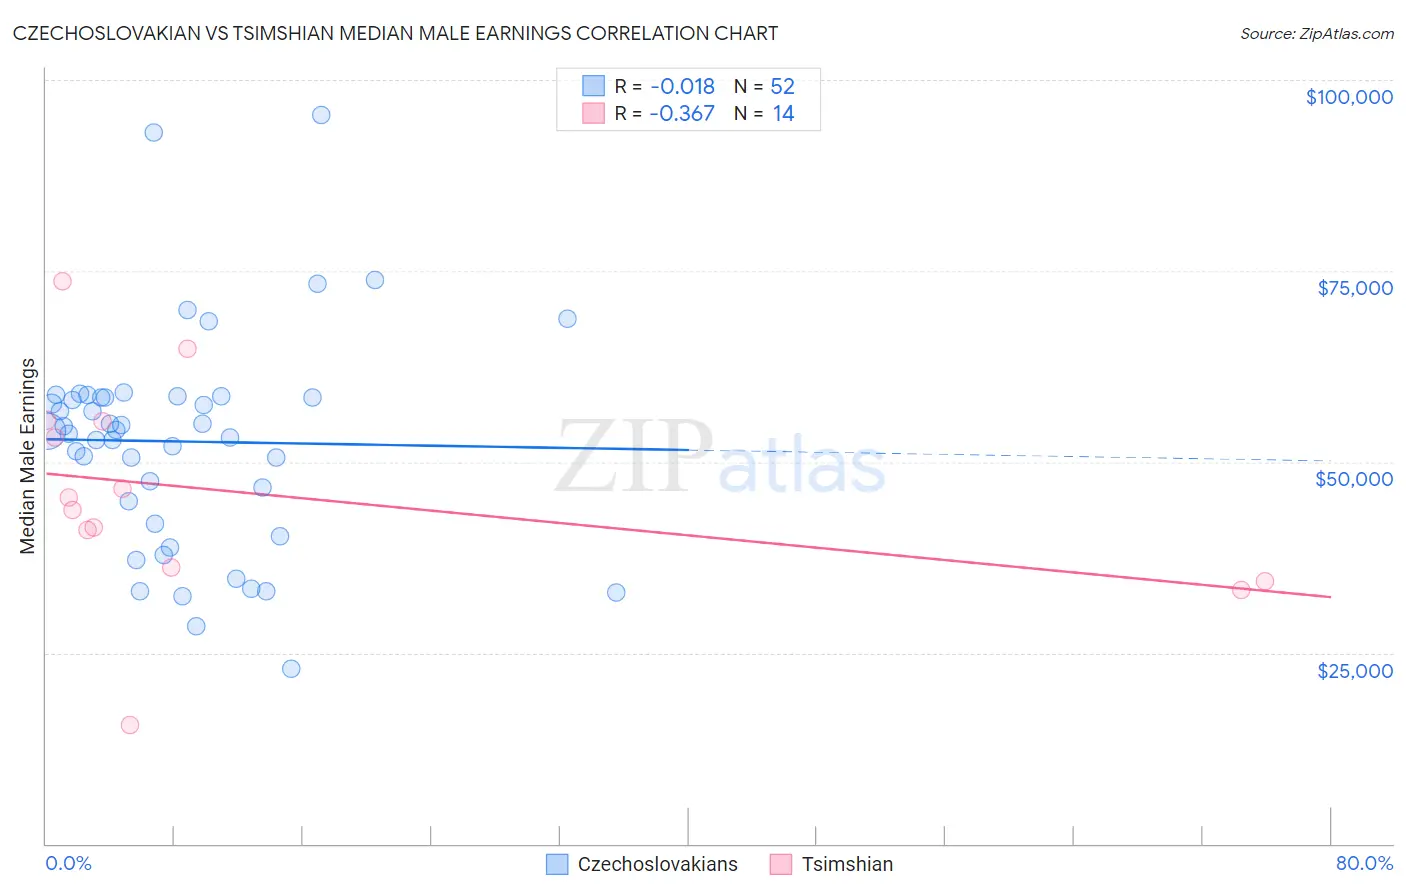
Czechoslovakian vs Tsimshian Median Male Earnings Correlation Chart
The statistical analysis conducted on geographies consisting of 368,529,148 people shows no correlation between the proportion of Czechoslovakians and median male earnings in the United States with a correlation coefficient (R) of -0.018 and weighted average of $55,382. Similarly, the statistical analysis conducted on geographies consisting of 15,625,423 people shows a mild negative correlation between the proportion of Tsimshian and median male earnings in the United States with a correlation coefficient (R) of -0.367 and weighted average of $48,836, a difference of 13.4%.
Median Male Earnings Correlation Summary
| Measurement | Czechoslovakian | Tsimshian |
| Minimum | $22,917 | $15,625 |
| Maximum | $95,417 | $73,588 |
| Range | $72,500 | $57,963 |
| Mean | $52,664 | $45,710 |
| Median | $54,109 | $44,489 |
| Interquartile 25% (IQ1) | $43,411 | $36,250 |
| Interquartile 75% (IQ3) | $58,532 | $55,386 |
| Interquartile Range (IQR) | $15,121 | $19,136 |
| Standard Deviation (Sample) | $14,290 | $14,437 |
| Standard Deviation (Population) | $14,152 | $13,911 |
Similar Demographics by Median Male Earnings
Demographics Similar to Czechoslovakians by Median Male Earnings
In terms of median male earnings, the demographic groups most similar to Czechoslovakians are Alsatian ($55,380, a difference of 0.0%), Basque ($55,370, a difference of 0.020%), Belgian ($55,361, a difference of 0.040%), Icelander ($55,415, a difference of 0.060%), and French ($55,350, a difference of 0.060%).
| Demographics | Rating | Rank | Median Male Earnings |
| Immigrants | Oceania | 76.8 /100 | #151 | Good $55,712 |
| Peruvians | 75.8 /100 | #152 | Good $55,659 |
| Immigrants | Nepal | 75.0 /100 | #153 | Good $55,615 |
| Taiwanese | 73.9 /100 | #154 | Good $55,556 |
| Scandinavians | 73.4 /100 | #155 | Good $55,527 |
| Immigrants | Ethiopia | 71.6 /100 | #156 | Good $55,434 |
| Icelanders | 71.2 /100 | #157 | Good $55,415 |
| Czechoslovakians | 70.5 /100 | #158 | Good $55,382 |
| Alsatians | 70.5 /100 | #159 | Good $55,380 |
| Basques | 70.3 /100 | #160 | Good $55,370 |
| Belgians | 70.1 /100 | #161 | Good $55,361 |
| French | 69.9 /100 | #162 | Good $55,350 |
| Ugandans | 68.6 /100 | #163 | Good $55,290 |
| Immigrants | South Eastern Asia | 67.6 /100 | #164 | Good $55,241 |
| Immigrants | Portugal | 66.3 /100 | #165 | Good $55,182 |
Demographics Similar to Tsimshian by Median Male Earnings
In terms of median male earnings, the demographic groups most similar to Tsimshian are Ute ($48,899, a difference of 0.13%), Potawatomi ($48,768, a difference of 0.14%), Cherokee ($48,669, a difference of 0.34%), Spanish American ($49,008, a difference of 0.35%), and Somali ($49,025, a difference of 0.39%).
| Demographics | Rating | Rank | Median Male Earnings |
| Immigrants | West Indies | 0.6 /100 | #262 | Tragic $49,271 |
| Nicaraguans | 0.6 /100 | #263 | Tragic $49,215 |
| Immigrants | Middle Africa | 0.6 /100 | #264 | Tragic $49,201 |
| Immigrants | Laos | 0.6 /100 | #265 | Tragic $49,190 |
| Somalis | 0.5 /100 | #266 | Tragic $49,025 |
| Spanish Americans | 0.5 /100 | #267 | Tragic $49,008 |
| Ute | 0.4 /100 | #268 | Tragic $48,899 |
| Tsimshian | 0.4 /100 | #269 | Tragic $48,836 |
| Potawatomi | 0.4 /100 | #270 | Tragic $48,768 |
| Cherokee | 0.3 /100 | #271 | Tragic $48,669 |
| Salvadorans | 0.3 /100 | #272 | Tragic $48,646 |
| Jamaicans | 0.3 /100 | #273 | Tragic $48,632 |
| Colville | 0.3 /100 | #274 | Tragic $48,516 |
| Immigrants | Somalia | 0.3 /100 | #275 | Tragic $48,439 |
| Blackfeet | 0.3 /100 | #276 | Tragic $48,402 |