Irish vs Syrian Single Mother Households
COMPARE
Irish
Syrian
Single Mother Households
Single Mother Households Comparison
Irish
Syrians
5.8%
SINGLE MOTHER HOUSEHOLDS
94.8/ 100
METRIC RATING
115th/ 347
METRIC RANK
6.0%
SINGLE MOTHER HOUSEHOLDS
86.0/ 100
METRIC RATING
139th/ 347
METRIC RANK
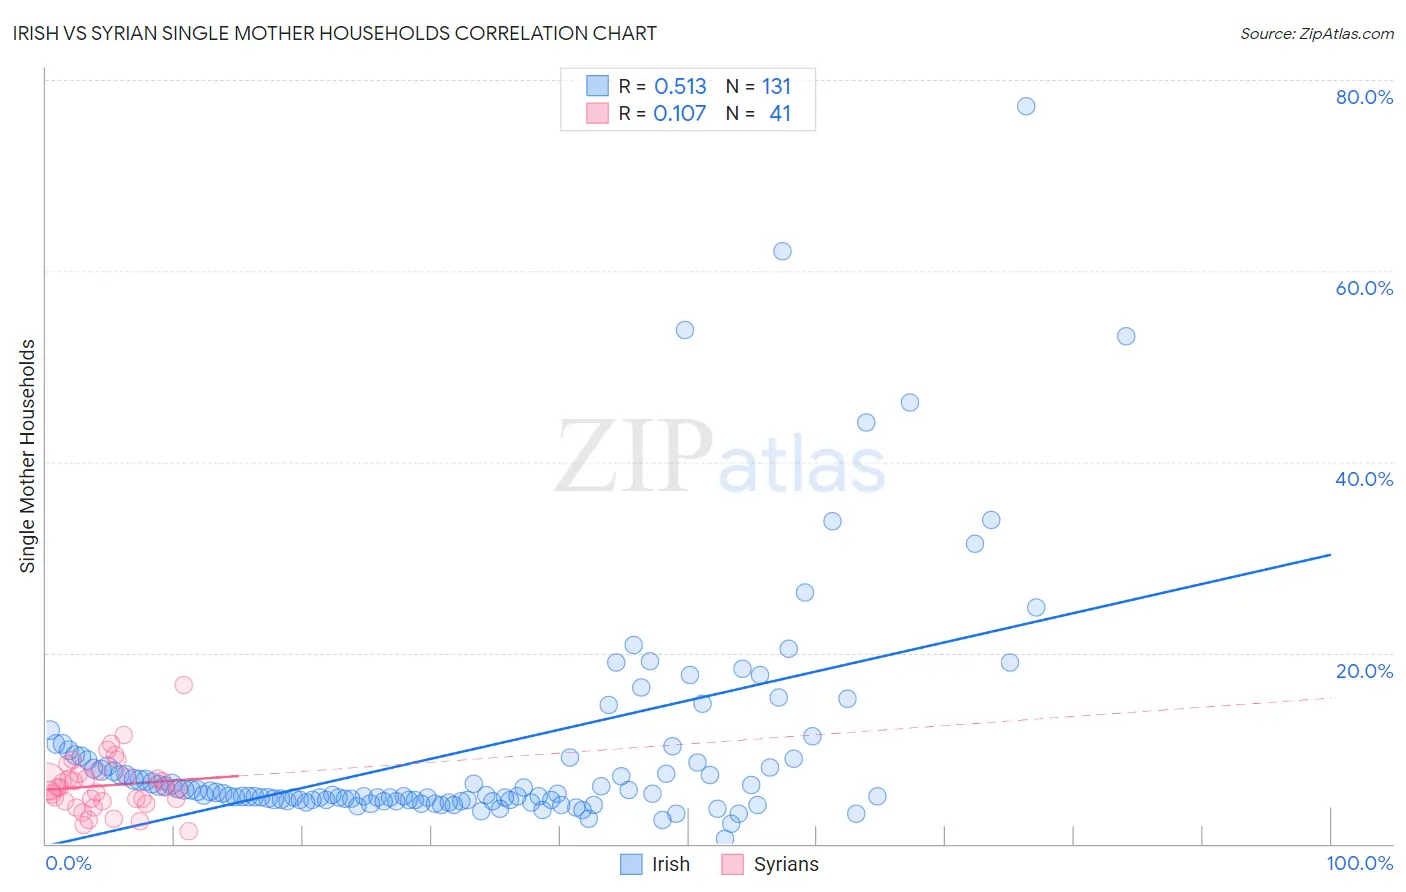
Irish vs Syrian Single Mother Households Correlation Chart
The statistical analysis conducted on geographies consisting of 573,559,537 people shows a substantial positive correlation between the proportion of Irish and percentage of single mother households in the United States with a correlation coefficient (R) of 0.513 and weighted average of 5.8%. Similarly, the statistical analysis conducted on geographies consisting of 265,755,115 people shows a poor positive correlation between the proportion of Syrians and percentage of single mother households in the United States with a correlation coefficient (R) of 0.107 and weighted average of 6.0%, a difference of 3.3%.
Single Mother Households Correlation Summary
| Measurement | Irish | Syrian |
| Minimum | 0.49% | 1.3% |
| Maximum | 77.3% | 16.6% |
| Range | 76.8% | 15.3% |
| Mean | 10.0% | 6.1% |
| Median | 5.2% | 5.8% |
| Interquartile 25% (IQ1) | 4.5% | 4.5% |
| Interquartile 75% (IQ3) | 9.0% | 7.1% |
| Interquartile Range (IQR) | 4.5% | 2.7% |
| Standard Deviation (Sample) | 12.1% | 2.9% |
| Standard Deviation (Population) | 12.0% | 2.8% |
Similar Demographics by Single Mother Households
Demographics Similar to Irish by Single Mother Households
In terms of single mother households, the demographic groups most similar to Irish are Pennsylvania German (5.8%, a difference of 0.070%), Bolivian (5.8%, a difference of 0.14%), Dutch (5.8%, a difference of 0.19%), Mongolian (5.8%, a difference of 0.31%), and Laotian (5.8%, a difference of 0.32%).
| Demographics | Rating | Rank | Single Mother Households |
| Immigrants | Italy | 95.8 /100 | #108 | Exceptional 5.8% |
| Immigrants | Western Europe | 95.7 /100 | #109 | Exceptional 5.8% |
| British | 95.5 /100 | #110 | Exceptional 5.8% |
| Immigrants | England | 95.5 /100 | #111 | Exceptional 5.8% |
| Immigrants | Kuwait | 95.4 /100 | #112 | Exceptional 5.8% |
| Mongolians | 95.3 /100 | #113 | Exceptional 5.8% |
| Dutch | 95.1 /100 | #114 | Exceptional 5.8% |
| Irish | 94.8 /100 | #115 | Exceptional 5.8% |
| Pennsylvania Germans | 94.7 /100 | #116 | Exceptional 5.8% |
| Bolivians | 94.6 /100 | #117 | Exceptional 5.8% |
| Laotians | 94.3 /100 | #118 | Exceptional 5.8% |
| South Africans | 94.1 /100 | #119 | Exceptional 5.8% |
| Tongans | 93.7 /100 | #120 | Exceptional 5.8% |
| Argentineans | 93.7 /100 | #121 | Exceptional 5.8% |
| Belgians | 93.5 /100 | #122 | Exceptional 5.8% |
Demographics Similar to Syrians by Single Mother Households
In terms of single mother households, the demographic groups most similar to Syrians are French (6.0%, a difference of 0.070%), Tsimshian (6.0%, a difference of 0.17%), Immigrants from Egypt (6.0%, a difference of 0.22%), Icelander (6.0%, a difference of 0.23%), and Immigrants from Iraq (6.0%, a difference of 0.26%).
| Demographics | Rating | Rank | Single Mother Households |
| Albanians | 91.1 /100 | #132 | Exceptional 5.9% |
| Egyptians | 90.7 /100 | #133 | Exceptional 5.9% |
| Canadians | 90.5 /100 | #134 | Exceptional 5.9% |
| Immigrants | Saudi Arabia | 90.2 /100 | #135 | Exceptional 5.9% |
| Jordanians | 88.9 /100 | #136 | Excellent 6.0% |
| Immigrants | Pakistan | 88.4 /100 | #137 | Excellent 6.0% |
| Icelanders | 86.9 /100 | #138 | Excellent 6.0% |
| Syrians | 86.0 /100 | #139 | Excellent 6.0% |
| French | 85.7 /100 | #140 | Excellent 6.0% |
| Tsimshian | 85.2 /100 | #141 | Excellent 6.0% |
| Immigrants | Egypt | 85.0 /100 | #142 | Excellent 6.0% |
| Immigrants | Iraq | 84.8 /100 | #143 | Excellent 6.0% |
| Koreans | 84.4 /100 | #144 | Excellent 6.0% |
| Arabs | 84.0 /100 | #145 | Excellent 6.0% |
| French Canadians | 82.6 /100 | #146 | Excellent 6.0% |