Cypriot vs Syrian Unemployment Among Ages 55 to 59 years
COMPARE
Cypriot
Syrian
Unemployment Among Ages 55 to 59 years
Unemployment Among Ages 55 to 59 years Comparison
Cypriots
Syrians
4.5%
UNEMPLOYMENT AMONG AGES 55 TO 59 YEARS
99.9/ 100
METRIC RATING
35th/ 347
METRIC RANK
4.9%
UNEMPLOYMENT AMONG AGES 55 TO 59 YEARS
8.6/ 100
METRIC RATING
215th/ 347
METRIC RANK
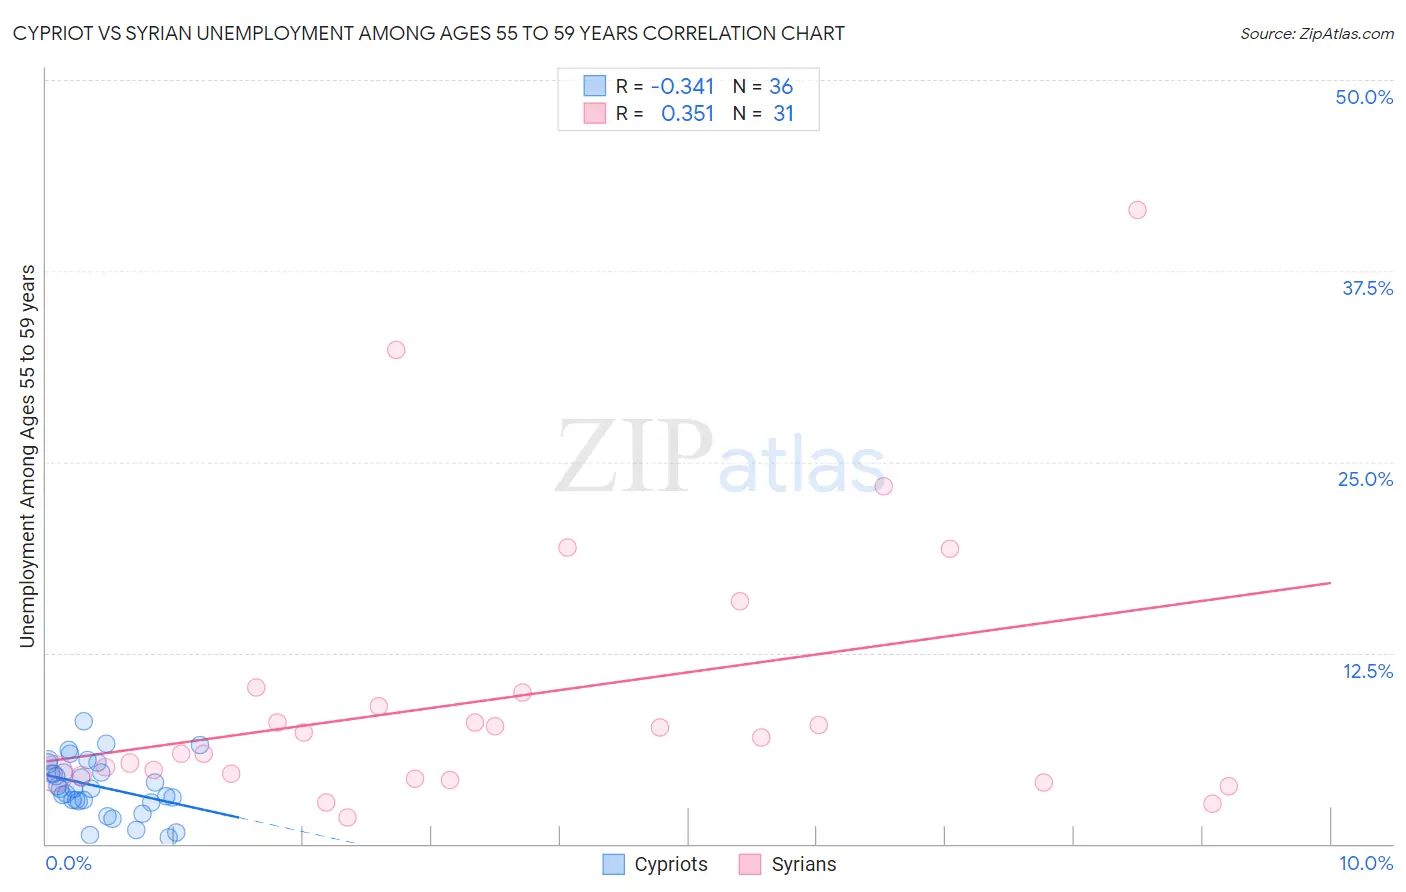
Cypriot vs Syrian Unemployment Among Ages 55 to 59 years Correlation Chart
The statistical analysis conducted on geographies consisting of 60,659,935 people shows a mild negative correlation between the proportion of Cypriots and unemployment rate among population between the ages 55 and 59 in the United States with a correlation coefficient (R) of -0.341 and weighted average of 4.5%. Similarly, the statistical analysis conducted on geographies consisting of 254,024,924 people shows a mild positive correlation between the proportion of Syrians and unemployment rate among population between the ages 55 and 59 in the United States with a correlation coefficient (R) of 0.351 and weighted average of 4.9%, a difference of 10.3%.
Unemployment Among Ages 55 to 59 years Correlation Summary
| Measurement | Cypriot | Syrian |
| Minimum | 0.40% | 1.7% |
| Maximum | 8.0% | 41.5% |
| Range | 7.6% | 39.8% |
| Mean | 3.8% | 9.6% |
| Median | 3.6% | 7.0% |
| Interquartile 25% (IQ1) | 2.8% | 4.4% |
| Interquartile 75% (IQ3) | 5.0% | 9.9% |
| Interquartile Range (IQR) | 2.1% | 5.5% |
| Standard Deviation (Sample) | 1.8% | 9.0% |
| Standard Deviation (Population) | 1.8% | 8.9% |
Similar Demographics by Unemployment Among Ages 55 to 59 years
Demographics Similar to Cypriots by Unemployment Among Ages 55 to 59 years
In terms of unemployment among ages 55 to 59 years, the demographic groups most similar to Cypriots are Thai (4.5%, a difference of 0.010%), Belgian (4.5%, a difference of 0.090%), Ethiopian (4.5%, a difference of 0.090%), Immigrants from Bulgaria (4.5%, a difference of 0.090%), and Immigrants from Ethiopia (4.5%, a difference of 0.21%).
| Demographics | Rating | Rank | Unemployment Among Ages 55 to 59 years |
| Immigrants | Eastern Africa | 99.9 /100 | #28 | Exceptional 4.5% |
| Palestinians | 99.9 /100 | #29 | Exceptional 4.5% |
| Immigrants | Kenya | 99.9 /100 | #30 | Exceptional 4.5% |
| Germans | 99.9 /100 | #31 | Exceptional 4.5% |
| Immigrants | Ethiopia | 99.9 /100 | #32 | Exceptional 4.5% |
| Belgians | 99.9 /100 | #33 | Exceptional 4.5% |
| Thais | 99.9 /100 | #34 | Exceptional 4.5% |
| Cypriots | 99.9 /100 | #35 | Exceptional 4.5% |
| Ethiopians | 99.9 /100 | #36 | Exceptional 4.5% |
| Immigrants | Bulgaria | 99.9 /100 | #37 | Exceptional 4.5% |
| Assyrians/Chaldeans/Syriacs | 99.9 /100 | #38 | Exceptional 4.5% |
| English | 99.9 /100 | #39 | Exceptional 4.5% |
| Swiss | 99.8 /100 | #40 | Exceptional 4.5% |
| Luxembourgers | 99.8 /100 | #41 | Exceptional 4.5% |
| Immigrants | Kuwait | 99.8 /100 | #42 | Exceptional 4.5% |
Demographics Similar to Syrians by Unemployment Among Ages 55 to 59 years
In terms of unemployment among ages 55 to 59 years, the demographic groups most similar to Syrians are Spanish American (4.9%, a difference of 0.060%), Immigrants from Brazil (4.9%, a difference of 0.070%), Immigrants from Austria (4.9%, a difference of 0.080%), Immigrants from Nigeria (4.9%, a difference of 0.080%), and Indian (Asian) (4.9%, a difference of 0.14%).
| Demographics | Rating | Rank | Unemployment Among Ages 55 to 59 years |
| Immigrants | Kazakhstan | 14.0 /100 | #208 | Poor 4.9% |
| Immigrants | Haiti | 13.3 /100 | #209 | Poor 4.9% |
| Creek | 12.9 /100 | #210 | Poor 4.9% |
| Hawaiians | 12.8 /100 | #211 | Poor 4.9% |
| Immigrants | Nonimmigrants | 11.2 /100 | #212 | Poor 4.9% |
| Bermudans | 11.0 /100 | #213 | Poor 4.9% |
| Immigrants | Denmark | 10.3 /100 | #214 | Poor 4.9% |
| Syrians | 8.6 /100 | #215 | Tragic 4.9% |
| Spanish Americans | 8.1 /100 | #216 | Tragic 4.9% |
| Immigrants | Brazil | 8.1 /100 | #217 | Tragic 4.9% |
| Immigrants | Austria | 8.0 /100 | #218 | Tragic 4.9% |
| Immigrants | Nigeria | 8.0 /100 | #219 | Tragic 4.9% |
| Indians (Asian) | 7.6 /100 | #220 | Tragic 4.9% |
| Nigerians | 7.5 /100 | #221 | Tragic 4.9% |
| Spanish | 5.1 /100 | #222 | Tragic 5.0% |