Cuban vs Asian Family Households
COMPARE
Cuban
Asian
Family Households
Family Households Comparison
Cubans
Asians
67.7%
FAMILY HOUSEHOLDS
100.0/ 100
METRIC RATING
21st/ 347
METRIC RANK
66.5%
FAMILY HOUSEHOLDS
100.0/ 100
METRIC RATING
44th/ 347
METRIC RANK
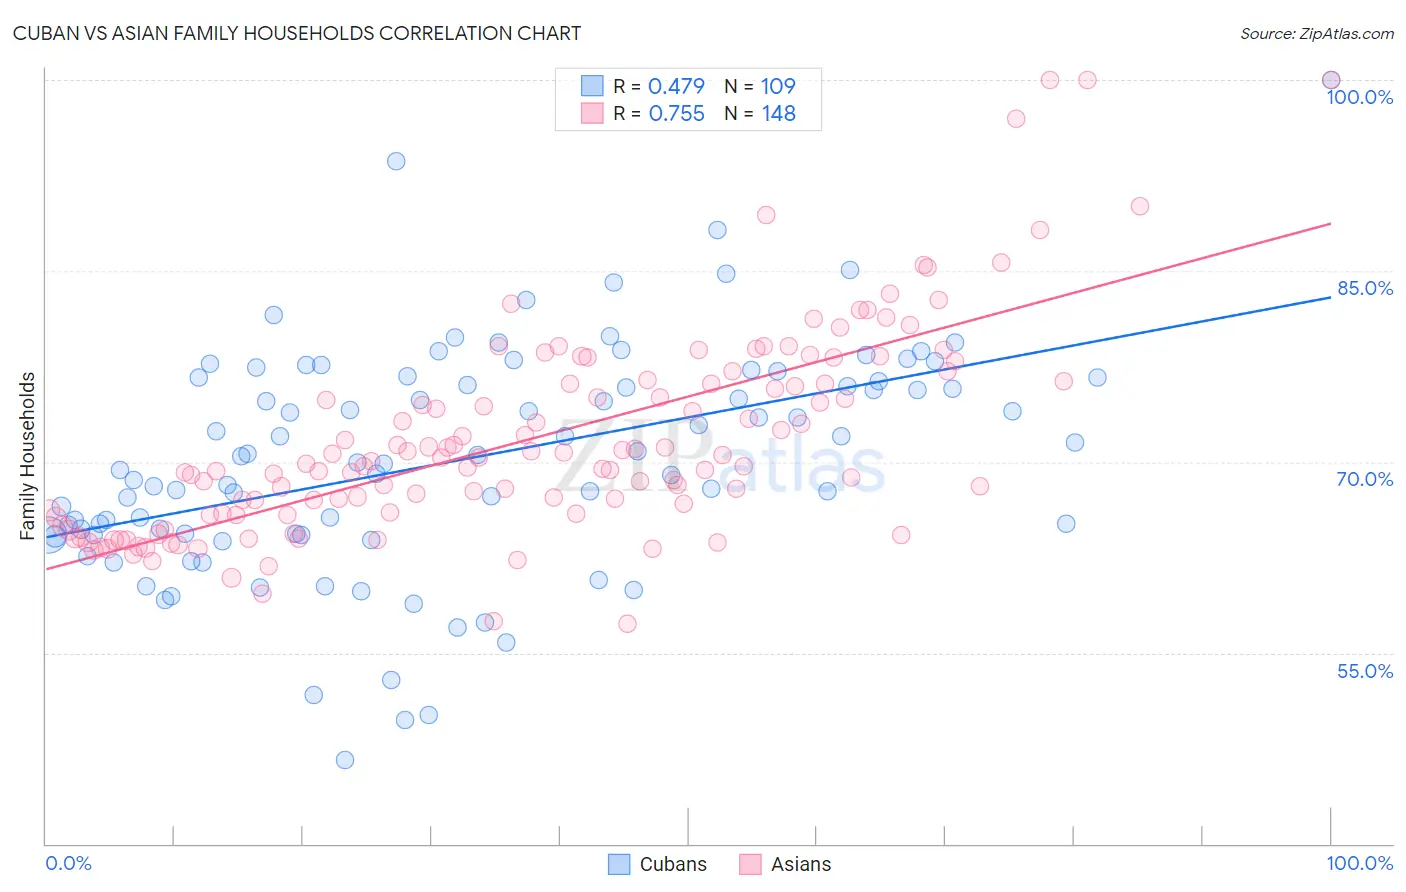
Cuban vs Asian Family Households Correlation Chart
The statistical analysis conducted on geographies consisting of 448,974,040 people shows a moderate positive correlation between the proportion of Cubans and percentage of family households in the United States with a correlation coefficient (R) of 0.479 and weighted average of 67.7%. Similarly, the statistical analysis conducted on geographies consisting of 550,272,164 people shows a strong positive correlation between the proportion of Asians and percentage of family households in the United States with a correlation coefficient (R) of 0.755 and weighted average of 66.5%, a difference of 1.9%.
Family Households Correlation Summary
| Measurement | Cuban | Asian |
| Minimum | 46.6% | 57.2% |
| Maximum | 100.0% | 100.0% |
| Range | 53.4% | 42.8% |
| Mean | 70.2% | 71.8% |
| Median | 70.5% | 70.0% |
| Interquartile 25% (IQ1) | 64.3% | 65.9% |
| Interquartile 75% (IQ3) | 76.6% | 76.2% |
| Interquartile Range (IQR) | 12.3% | 10.4% |
| Standard Deviation (Sample) | 9.0% | 8.1% |
| Standard Deviation (Population) | 9.0% | 8.1% |
Similar Demographics by Family Households
Demographics Similar to Cubans by Family Households
In terms of family households, the demographic groups most similar to Cubans are Sri Lankan (67.7%, a difference of 0.040%), Inupiat (67.8%, a difference of 0.050%), Immigrants from Pakistan (67.7%, a difference of 0.12%), Samoan (67.9%, a difference of 0.30%), and Immigrants from South Eastern Asia (67.5%, a difference of 0.41%).
| Demographics | Rating | Rank | Family Households |
| Immigrants | Cuba | 100.0 /100 | #14 | Exceptional 68.2% |
| Assyrians/Chaldeans/Syriacs | 100.0 /100 | #15 | Exceptional 68.2% |
| Immigrants | Vietnam | 100.0 /100 | #16 | Exceptional 68.2% |
| Chinese | 100.0 /100 | #17 | Exceptional 68.1% |
| Immigrants | Taiwan | 100.0 /100 | #18 | Exceptional 68.0% |
| Samoans | 100.0 /100 | #19 | Exceptional 67.9% |
| Inupiat | 100.0 /100 | #20 | Exceptional 67.8% |
| Cubans | 100.0 /100 | #21 | Exceptional 67.7% |
| Sri Lankans | 100.0 /100 | #22 | Exceptional 67.7% |
| Immigrants | Pakistan | 100.0 /100 | #23 | Exceptional 67.7% |
| Immigrants | South Eastern Asia | 100.0 /100 | #24 | Exceptional 67.5% |
| Immigrants | Nicaragua | 100.0 /100 | #25 | Exceptional 67.5% |
| Immigrants | India | 100.0 /100 | #26 | Exceptional 67.4% |
| Hispanics or Latinos | 100.0 /100 | #27 | Exceptional 67.4% |
| Hawaiians | 100.0 /100 | #28 | Exceptional 67.4% |
Demographics Similar to Asians by Family Households
In terms of family households, the demographic groups most similar to Asians are Venezuelan (66.5%, a difference of 0.020%), Apache (66.5%, a difference of 0.050%), Arapaho (66.5%, a difference of 0.050%), Menominee (66.5%, a difference of 0.060%), and Bolivian (66.5%, a difference of 0.070%).
| Demographics | Rating | Rank | Family Households |
| Tsimshian | 100.0 /100 | #37 | Exceptional 67.1% |
| Mexican American Indians | 100.0 /100 | #38 | Exceptional 67.0% |
| Immigrants | El Salvador | 100.0 /100 | #39 | Exceptional 67.0% |
| Guamanians/Chamorros | 100.0 /100 | #40 | Exceptional 66.6% |
| Immigrants | Bolivia | 100.0 /100 | #41 | Exceptional 66.6% |
| Menominee | 100.0 /100 | #42 | Exceptional 66.5% |
| Apache | 100.0 /100 | #43 | Exceptional 66.5% |
| Asians | 100.0 /100 | #44 | Exceptional 66.5% |
| Venezuelans | 100.0 /100 | #45 | Exceptional 66.5% |
| Arapaho | 100.0 /100 | #46 | Exceptional 66.5% |
| Bolivians | 100.0 /100 | #47 | Exceptional 66.5% |
| Immigrants | Venezuela | 100.0 /100 | #48 | Exceptional 66.4% |
| Immigrants | South Central Asia | 100.0 /100 | #49 | Exceptional 66.4% |
| Navajo | 100.0 /100 | #50 | Exceptional 66.4% |
| Natives/Alaskans | 100.0 /100 | #51 | Exceptional 66.4% |