Cuban vs Osage Family Households
COMPARE
Cuban
Osage
Family Households
Family Households Comparison
Cubans
Osage
67.7%
FAMILY HOUSEHOLDS
100.0/ 100
METRIC RATING
21st/ 347
METRIC RANK
63.7%
FAMILY HOUSEHOLDS
7.0/ 100
METRIC RATING
217th/ 347
METRIC RANK
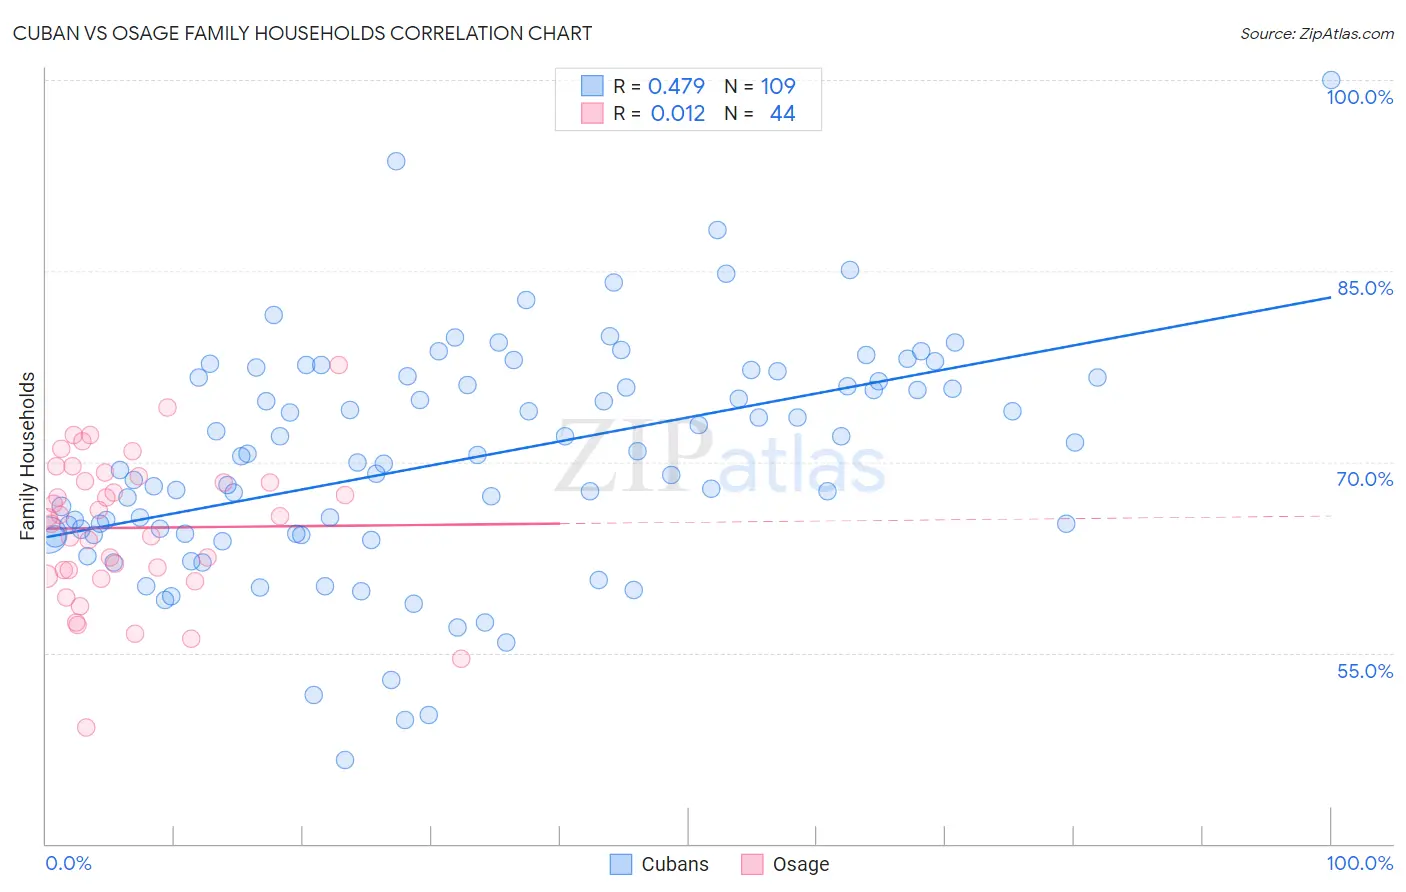
Cuban vs Osage Family Households Correlation Chart
The statistical analysis conducted on geographies consisting of 448,974,040 people shows a moderate positive correlation between the proportion of Cubans and percentage of family households in the United States with a correlation coefficient (R) of 0.479 and weighted average of 67.7%. Similarly, the statistical analysis conducted on geographies consisting of 91,796,062 people shows no correlation between the proportion of Osage and percentage of family households in the United States with a correlation coefficient (R) of 0.012 and weighted average of 63.7%, a difference of 6.3%.
Family Households Correlation Summary
| Measurement | Cuban | Osage |
| Minimum | 46.6% | 49.2% |
| Maximum | 100.0% | 77.6% |
| Range | 53.4% | 28.5% |
| Mean | 70.2% | 64.8% |
| Median | 70.5% | 65.7% |
| Interquartile 25% (IQ1) | 64.3% | 61.3% |
| Interquartile 75% (IQ3) | 76.6% | 68.7% |
| Interquartile Range (IQR) | 12.3% | 7.4% |
| Standard Deviation (Sample) | 9.0% | 5.7% |
| Standard Deviation (Population) | 9.0% | 5.7% |
Similar Demographics by Family Households
Demographics Similar to Cubans by Family Households
In terms of family households, the demographic groups most similar to Cubans are Sri Lankan (67.7%, a difference of 0.040%), Inupiat (67.8%, a difference of 0.050%), Immigrants from Pakistan (67.7%, a difference of 0.12%), Samoan (67.9%, a difference of 0.30%), and Immigrants from South Eastern Asia (67.5%, a difference of 0.41%).
| Demographics | Rating | Rank | Family Households |
| Immigrants | Cuba | 100.0 /100 | #14 | Exceptional 68.2% |
| Assyrians/Chaldeans/Syriacs | 100.0 /100 | #15 | Exceptional 68.2% |
| Immigrants | Vietnam | 100.0 /100 | #16 | Exceptional 68.2% |
| Chinese | 100.0 /100 | #17 | Exceptional 68.1% |
| Immigrants | Taiwan | 100.0 /100 | #18 | Exceptional 68.0% |
| Samoans | 100.0 /100 | #19 | Exceptional 67.9% |
| Inupiat | 100.0 /100 | #20 | Exceptional 67.8% |
| Cubans | 100.0 /100 | #21 | Exceptional 67.7% |
| Sri Lankans | 100.0 /100 | #22 | Exceptional 67.7% |
| Immigrants | Pakistan | 100.0 /100 | #23 | Exceptional 67.7% |
| Immigrants | South Eastern Asia | 100.0 /100 | #24 | Exceptional 67.5% |
| Immigrants | Nicaragua | 100.0 /100 | #25 | Exceptional 67.5% |
| Immigrants | India | 100.0 /100 | #26 | Exceptional 67.4% |
| Hispanics or Latinos | 100.0 /100 | #27 | Exceptional 67.4% |
| Hawaiians | 100.0 /100 | #28 | Exceptional 67.4% |
Demographics Similar to Osage by Family Households
In terms of family households, the demographic groups most similar to Osage are Marshallese (63.7%, a difference of 0.0%), Croatian (63.8%, a difference of 0.010%), Belgian (63.8%, a difference of 0.030%), Macedonian (63.7%, a difference of 0.030%), and Immigrants from Europe (63.7%, a difference of 0.030%).
| Demographics | Rating | Rank | Family Households |
| Immigrants | Thailand | 9.6 /100 | #210 | Tragic 63.8% |
| Shoshone | 9.4 /100 | #211 | Tragic 63.8% |
| Immigrants | Netherlands | 9.4 /100 | #212 | Tragic 63.8% |
| Immigrants | Northern Europe | 8.8 /100 | #213 | Tragic 63.8% |
| Celtics | 8.0 /100 | #214 | Tragic 63.8% |
| Belgians | 7.6 /100 | #215 | Tragic 63.8% |
| Croatians | 7.3 /100 | #216 | Tragic 63.8% |
| Osage | 7.0 /100 | #217 | Tragic 63.7% |
| Marshallese | 6.9 /100 | #218 | Tragic 63.7% |
| Macedonians | 6.5 /100 | #219 | Tragic 63.7% |
| Immigrants | Europe | 6.4 /100 | #220 | Tragic 63.7% |
| Immigrants | South Africa | 5.9 /100 | #221 | Tragic 63.7% |
| Immigrants | Belarus | 5.5 /100 | #222 | Tragic 63.7% |
| French Canadians | 5.4 /100 | #223 | Tragic 63.7% |
| Turks | 4.5 /100 | #224 | Tragic 63.6% |