Cuban vs Haitian Births to Unmarried Women
COMPARE
Cuban
Haitian
Births to Unmarried Women
Births to Unmarried Women Comparison
Cubans
Haitians
39.4%
BIRTHS TO UNMARRIED WOMEN
0.0/ 100
METRIC RATING
309th/ 347
METRIC RANK
38.6%
BIRTHS TO UNMARRIED WOMEN
0.0/ 100
METRIC RATING
301st/ 347
METRIC RANK
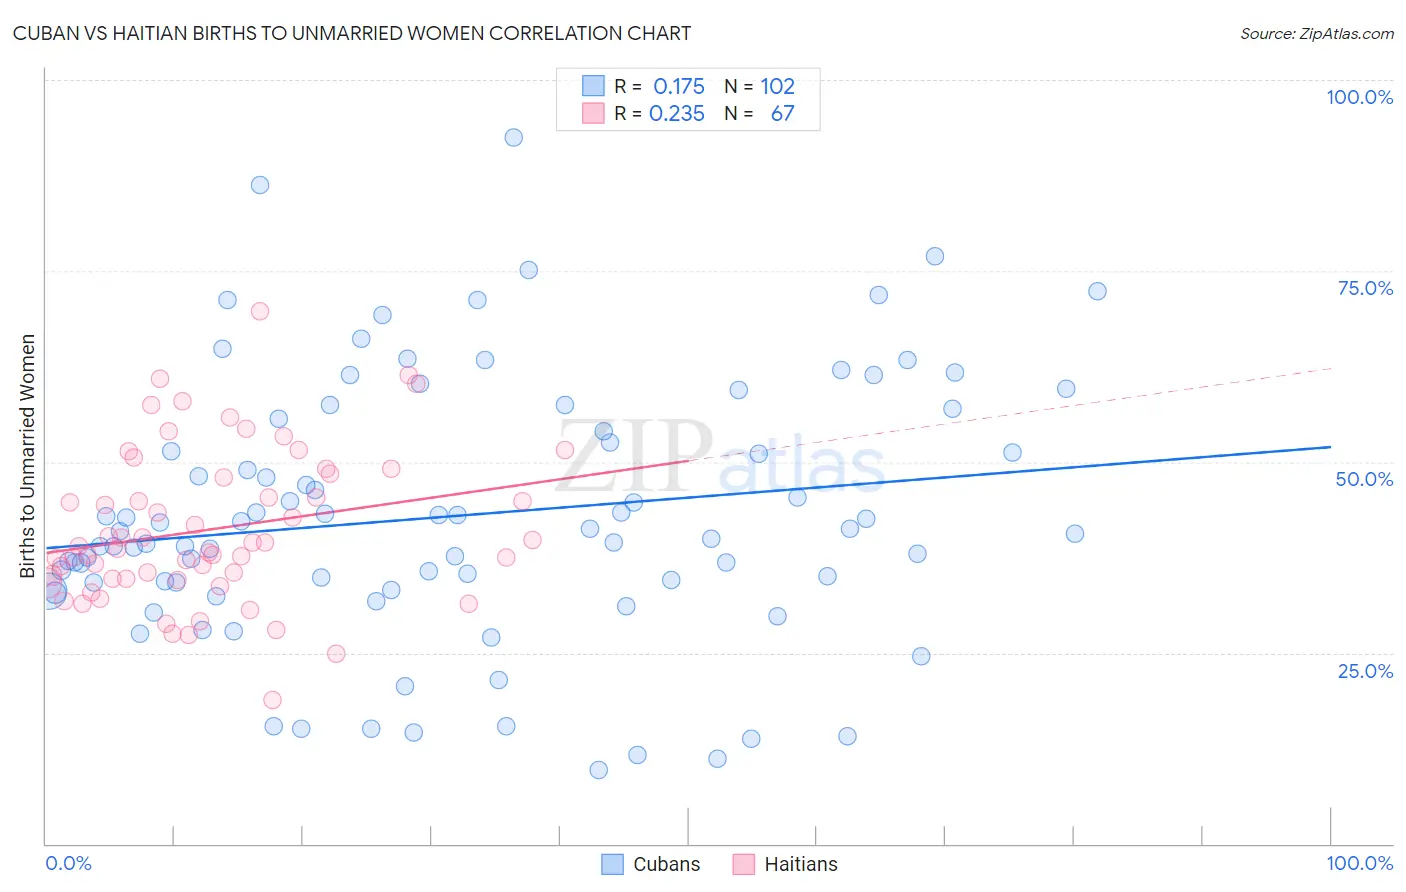
Cuban vs Haitian Births to Unmarried Women Correlation Chart
The statistical analysis conducted on geographies consisting of 417,413,482 people shows a poor positive correlation between the proportion of Cubans and percentage of births to unmarried women in the United States with a correlation coefficient (R) of 0.175 and weighted average of 39.4%. Similarly, the statistical analysis conducted on geographies consisting of 274,356,790 people shows a weak positive correlation between the proportion of Haitians and percentage of births to unmarried women in the United States with a correlation coefficient (R) of 0.235 and weighted average of 38.6%, a difference of 2.1%.
Births to Unmarried Women Correlation Summary
| Measurement | Cuban | Haitian |
| Minimum | 9.6% | 18.8% |
| Maximum | 92.5% | 69.7% |
| Range | 82.9% | 50.9% |
| Mean | 42.9% | 41.2% |
| Median | 40.7% | 38.9% |
| Interquartile 25% (IQ1) | 34.2% | 34.7% |
| Interquartile 75% (IQ3) | 54.0% | 48.5% |
| Interquartile Range (IQR) | 19.8% | 13.8% |
| Standard Deviation (Sample) | 17.0% | 10.0% |
| Standard Deviation (Population) | 16.9% | 9.9% |
Demographics Similar to Cubans and Haitians by Births to Unmarried Women
In terms of births to unmarried women, the demographic groups most similar to Cubans are Aleut (39.3%, a difference of 0.12%), Immigrants from Honduras (39.3%, a difference of 0.21%), Immigrants from Dominica (39.5%, a difference of 0.22%), Immigrants from the Azores (39.6%, a difference of 0.46%), and U.S. Virgin Islander (39.6%, a difference of 0.48%). Similarly, the demographic groups most similar to Haitians are Immigrants from West Indies (38.6%, a difference of 0.010%), Spanish American (38.6%, a difference of 0.070%), Honduran (38.7%, a difference of 0.24%), Jamaican (38.5%, a difference of 0.27%), and Dutch West Indian (38.4%, a difference of 0.47%).
| Demographics | Rating | Rank | Births to Unmarried Women |
| Iroquois | 0.0 /100 | #295 | Tragic 38.2% |
| Alaska Natives | 0.0 /100 | #296 | Tragic 38.3% |
| Dutch West Indians | 0.0 /100 | #297 | Tragic 38.4% |
| Jamaicans | 0.0 /100 | #298 | Tragic 38.5% |
| Spanish Americans | 0.0 /100 | #299 | Tragic 38.6% |
| Immigrants | West Indies | 0.0 /100 | #300 | Tragic 38.6% |
| Haitians | 0.0 /100 | #301 | Tragic 38.6% |
| Hondurans | 0.0 /100 | #302 | Tragic 38.7% |
| Immigrants | Jamaica | 0.0 /100 | #303 | Tragic 38.8% |
| Yaqui | 0.0 /100 | #304 | Tragic 38.8% |
| Immigrants | Haiti | 0.0 /100 | #305 | Tragic 38.9% |
| Central American Indians | 0.0 /100 | #306 | Tragic 39.0% |
| Immigrants | Honduras | 0.0 /100 | #307 | Tragic 39.3% |
| Aleuts | 0.0 /100 | #308 | Tragic 39.3% |
| Cubans | 0.0 /100 | #309 | Tragic 39.4% |
| Immigrants | Dominica | 0.0 /100 | #310 | Tragic 39.5% |
| Immigrants | Azores | 0.0 /100 | #311 | Tragic 39.6% |
| U.S. Virgin Islanders | 0.0 /100 | #312 | Tragic 39.6% |
| Africans | 0.0 /100 | #313 | Tragic 39.7% |
| Immigrants | Caribbean | 0.0 /100 | #314 | Tragic 39.8% |
| Dominicans | 0.0 /100 | #315 | Tragic 39.8% |