Japanese vs Colombian Births to Unmarried Women
COMPARE
Japanese
Colombian
Births to Unmarried Women
Births to Unmarried Women Comparison
Japanese
Colombians
35.2%
BIRTHS TO UNMARRIED WOMEN
0.9/ 100
METRIC RATING
243rd/ 347
METRIC RANK
32.2%
BIRTHS TO UNMARRIED WOMEN
31.9/ 100
METRIC RATING
192nd/ 347
METRIC RANK
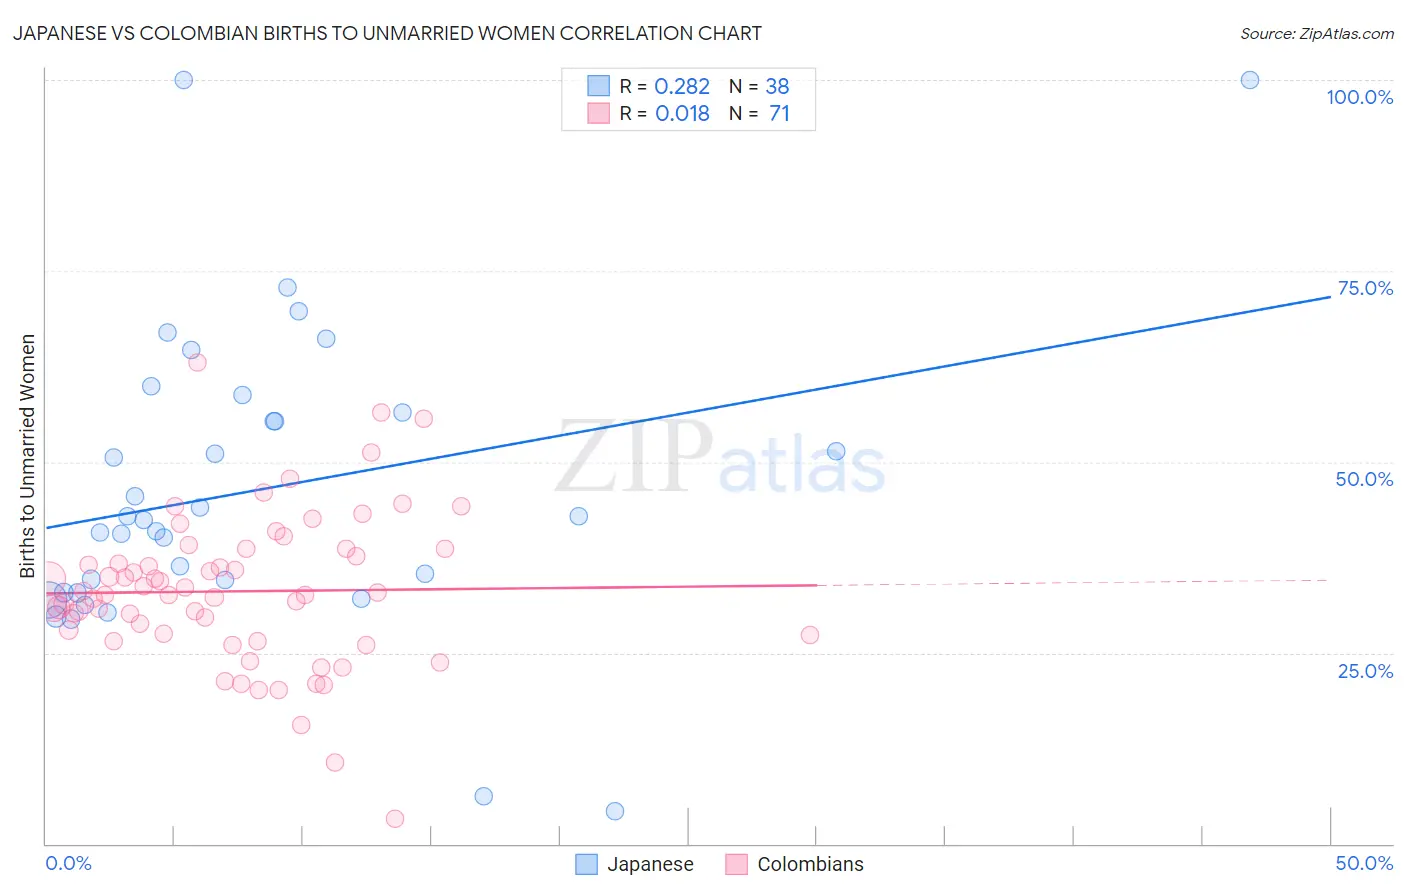
Japanese vs Colombian Births to Unmarried Women Correlation Chart
The statistical analysis conducted on geographies consisting of 240,312,984 people shows a weak positive correlation between the proportion of Japanese and percentage of births to unmarried women in the United States with a correlation coefficient (R) of 0.282 and weighted average of 35.2%. Similarly, the statistical analysis conducted on geographies consisting of 391,716,321 people shows no correlation between the proportion of Colombians and percentage of births to unmarried women in the United States with a correlation coefficient (R) of 0.018 and weighted average of 32.2%, a difference of 9.1%.
Births to Unmarried Women Correlation Summary
| Measurement | Japanese | Colombian |
| Minimum | 4.3% | 3.3% |
| Maximum | 100.0% | 63.0% |
| Range | 95.7% | 59.7% |
| Mean | 46.3% | 33.1% |
| Median | 42.6% | 32.6% |
| Interquartile 25% (IQ1) | 32.9% | 27.3% |
| Interquartile 75% (IQ3) | 56.4% | 38.6% |
| Interquartile Range (IQR) | 23.5% | 11.3% |
| Standard Deviation (Sample) | 19.9% | 10.0% |
| Standard Deviation (Population) | 19.7% | 9.9% |
Similar Demographics by Births to Unmarried Women
Demographics Similar to Japanese by Births to Unmarried Women
In terms of births to unmarried women, the demographic groups most similar to Japanese are Guyanese (35.2%, a difference of 0.060%), Shoshone (35.3%, a difference of 0.40%), Indonesian (35.0%, a difference of 0.49%), Nigerian (35.3%, a difference of 0.51%), and Immigrants from Guyana (35.0%, a difference of 0.59%).
| Demographics | Rating | Rank | Births to Unmarried Women |
| Immigrants | Cameroon | 1.6 /100 | #236 | Tragic 34.7% |
| Marshallese | 1.6 /100 | #237 | Tragic 34.8% |
| Immigrants | Cambodia | 1.6 /100 | #238 | Tragic 34.8% |
| Sierra Leoneans | 1.4 /100 | #239 | Tragic 34.9% |
| Immigrants | Middle Africa | 1.2 /100 | #240 | Tragic 34.9% |
| Immigrants | Guyana | 1.2 /100 | #241 | Tragic 35.0% |
| Indonesians | 1.2 /100 | #242 | Tragic 35.0% |
| Japanese | 0.9 /100 | #243 | Tragic 35.2% |
| Guyanese | 0.9 /100 | #244 | Tragic 35.2% |
| Shoshone | 0.8 /100 | #245 | Tragic 35.3% |
| Nigerians | 0.7 /100 | #246 | Tragic 35.3% |
| Immigrants | Nigeria | 0.7 /100 | #247 | Tragic 35.4% |
| Immigrants | Nonimmigrants | 0.6 /100 | #248 | Tragic 35.5% |
| Bermudans | 0.6 /100 | #249 | Tragic 35.5% |
| Mexican American Indians | 0.4 /100 | #250 | Tragic 35.7% |
Demographics Similar to Colombians by Births to Unmarried Women
In terms of births to unmarried women, the demographic groups most similar to Colombians are Irish (32.2%, a difference of 0.050%), Tlingit-Haida (32.2%, a difference of 0.080%), Fijian (32.3%, a difference of 0.090%), Sudanese (32.4%, a difference of 0.51%), and Immigrants from Kenya (32.1%, a difference of 0.52%).
| Demographics | Rating | Rank | Births to Unmarried Women |
| Germans | 39.5 /100 | #185 | Fair 32.0% |
| Welsh | 38.2 /100 | #186 | Fair 32.0% |
| Czechoslovakians | 38.0 /100 | #187 | Fair 32.0% |
| Osage | 37.1 /100 | #188 | Fair 32.1% |
| Immigrants | Kenya | 36.9 /100 | #189 | Fair 32.1% |
| Tlingit-Haida | 32.6 /100 | #190 | Fair 32.2% |
| Irish | 32.4 /100 | #191 | Fair 32.2% |
| Colombians | 31.9 /100 | #192 | Fair 32.2% |
| Fijians | 31.1 /100 | #193 | Fair 32.3% |
| Sudanese | 27.3 /100 | #194 | Fair 32.4% |
| Samoans | 21.9 /100 | #195 | Fair 32.6% |
| Immigrants | Colombia | 21.7 /100 | #196 | Fair 32.6% |
| Immigrants | Immigrants | 20.6 /100 | #197 | Fair 32.7% |
| Costa Ricans | 20.3 /100 | #198 | Fair 32.7% |
| Immigrants | Thailand | 18.9 /100 | #199 | Poor 32.8% |