Crow vs Syrian Divorced or Separated
COMPARE
Crow
Syrian
Divorced or Separated
Divorced or Separated Comparison
Crow
Syrians
14.1%
DIVORCED OR SEPARATED
0.0/ 100
METRIC RATING
337th/ 347
METRIC RANK
11.7%
DIVORCED OR SEPARATED
95.1/ 100
METRIC RATING
119th/ 347
METRIC RANK
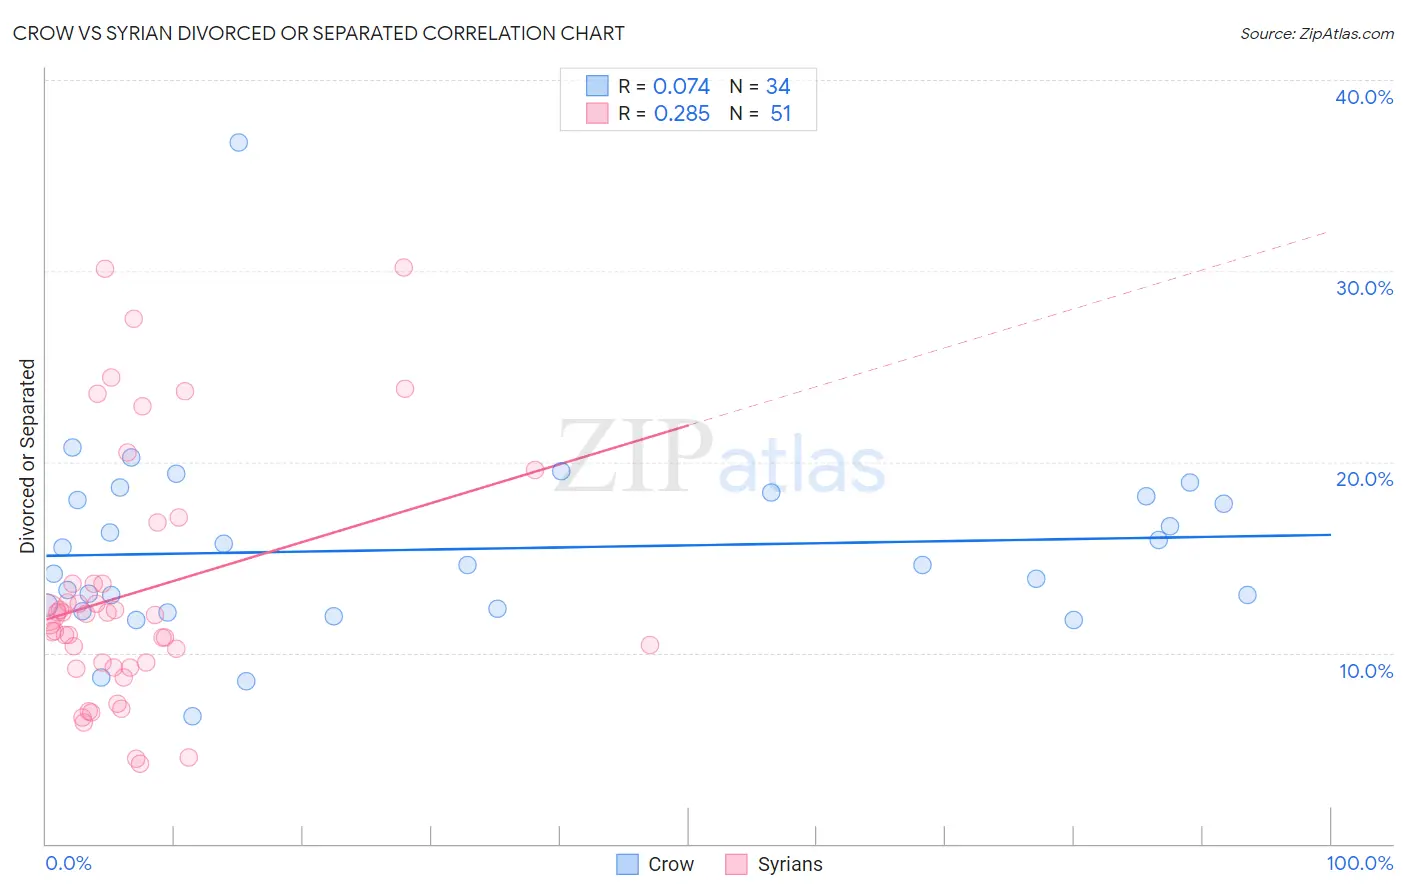
Crow vs Syrian Divorced or Separated Correlation Chart
The statistical analysis conducted on geographies consisting of 59,208,993 people shows a slight positive correlation between the proportion of Crow and percentage of population currently divorced or separated in the United States with a correlation coefficient (R) of 0.074 and weighted average of 14.1%. Similarly, the statistical analysis conducted on geographies consisting of 266,220,944 people shows a weak positive correlation between the proportion of Syrians and percentage of population currently divorced or separated in the United States with a correlation coefficient (R) of 0.285 and weighted average of 11.7%, a difference of 19.9%.
Divorced or Separated Correlation Summary
| Measurement | Crow | Syrian |
| Minimum | 6.7% | 4.2% |
| Maximum | 36.7% | 30.2% |
| Range | 30.0% | 26.0% |
| Mean | 15.4% | 13.2% |
| Median | 14.6% | 12.0% |
| Interquartile 25% (IQ1) | 12.3% | 9.3% |
| Interquartile 75% (IQ3) | 18.2% | 13.6% |
| Interquartile Range (IQR) | 5.9% | 4.4% |
| Standard Deviation (Sample) | 5.1% | 6.5% |
| Standard Deviation (Population) | 5.1% | 6.4% |
Similar Demographics by Divorced or Separated
Demographics Similar to Crow by Divorced or Separated
In terms of divorced or separated, the demographic groups most similar to Crow are Shoshone (14.0%, a difference of 0.28%), Choctaw (14.1%, a difference of 0.31%), Dutch West Indian (14.0%, a difference of 0.63%), Colville (14.2%, a difference of 0.84%), and Chickasaw (14.2%, a difference of 0.88%).
| Demographics | Rating | Rank | Divorced or Separated |
| Paiute | 0.0 /100 | #330 | Tragic 13.6% |
| Blacks/African Americans | 0.0 /100 | #331 | Tragic 13.6% |
| Cherokee | 0.0 /100 | #332 | Tragic 13.7% |
| Puerto Ricans | 0.0 /100 | #333 | Tragic 13.9% |
| Immigrants | Bahamas | 0.0 /100 | #334 | Tragic 13.9% |
| Dutch West Indians | 0.0 /100 | #335 | Tragic 14.0% |
| Shoshone | 0.0 /100 | #336 | Tragic 14.0% |
| Crow | 0.0 /100 | #337 | Tragic 14.1% |
| Choctaw | 0.0 /100 | #338 | Tragic 14.1% |
| Colville | 0.0 /100 | #339 | Tragic 14.2% |
| Chickasaw | 0.0 /100 | #340 | Tragic 14.2% |
| Bahamians | 0.0 /100 | #341 | Tragic 14.2% |
| Seminole | 0.0 /100 | #342 | Tragic 14.3% |
| Creek | 0.0 /100 | #343 | Tragic 14.4% |
| Cubans | 0.0 /100 | #344 | Tragic 14.5% |
Demographics Similar to Syrians by Divorced or Separated
In terms of divorced or separated, the demographic groups most similar to Syrians are Ecuadorian (11.7%, a difference of 0.040%), Immigrants from Uganda (11.7%, a difference of 0.050%), Immigrants from Iraq (11.7%, a difference of 0.060%), Iraqi (11.8%, a difference of 0.090%), and Romanian (11.8%, a difference of 0.10%).
| Demographics | Rating | Rank | Divorced or Separated |
| Immigrants | France | 96.6 /100 | #112 | Exceptional 11.7% |
| Estonians | 96.6 /100 | #113 | Exceptional 11.7% |
| Immigrants | Norway | 95.9 /100 | #114 | Exceptional 11.7% |
| Lithuanians | 95.7 /100 | #115 | Exceptional 11.7% |
| Immigrants | Iraq | 95.4 /100 | #116 | Exceptional 11.7% |
| Immigrants | Uganda | 95.3 /100 | #117 | Exceptional 11.7% |
| Ecuadorians | 95.3 /100 | #118 | Exceptional 11.7% |
| Syrians | 95.1 /100 | #119 | Exceptional 11.7% |
| Iraqis | 94.6 /100 | #120 | Exceptional 11.8% |
| Romanians | 94.5 /100 | #121 | Exceptional 11.8% |
| Menominee | 93.8 /100 | #122 | Exceptional 11.8% |
| Immigrants | Immigrants | 93.7 /100 | #123 | Exceptional 11.8% |
| Ugandans | 93.1 /100 | #124 | Exceptional 11.8% |
| Ukrainians | 92.3 /100 | #125 | Exceptional 11.8% |
| South American Indians | 92.1 /100 | #126 | Exceptional 11.8% |