Swiss vs Syrian Divorced or Separated
COMPARE
Swiss
Syrian
Divorced or Separated
Divorced or Separated Comparison
Swiss
Syrians
12.0%
DIVORCED OR SEPARATED
63.6/ 100
METRIC RATING
164th/ 347
METRIC RANK
11.7%
DIVORCED OR SEPARATED
95.1/ 100
METRIC RATING
119th/ 347
METRIC RANK
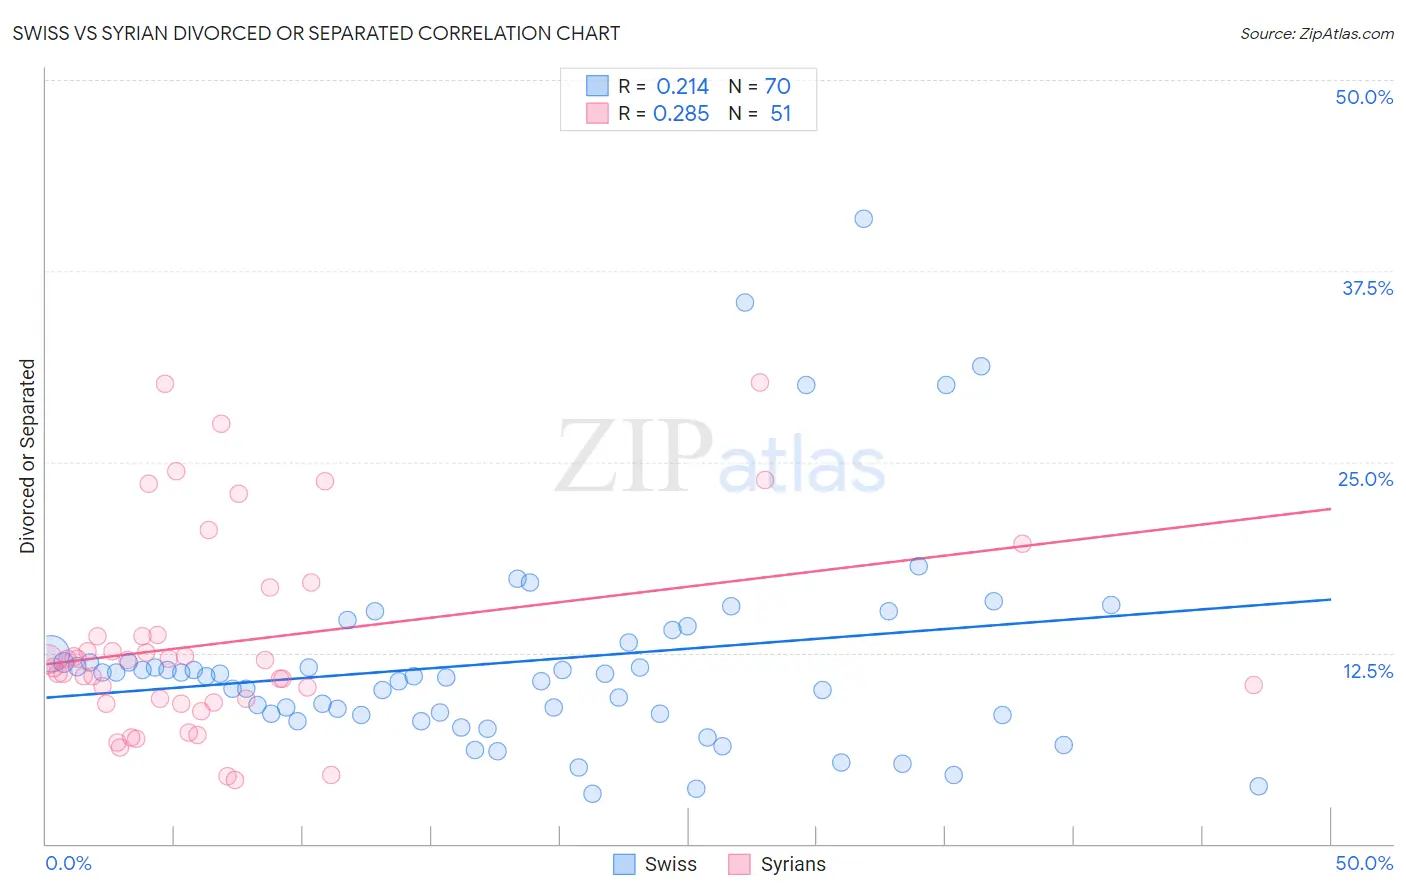
Swiss vs Syrian Divorced or Separated Correlation Chart
The statistical analysis conducted on geographies consisting of 464,828,209 people shows a weak positive correlation between the proportion of Swiss and percentage of population currently divorced or separated in the United States with a correlation coefficient (R) of 0.214 and weighted average of 12.0%. Similarly, the statistical analysis conducted on geographies consisting of 266,220,944 people shows a weak positive correlation between the proportion of Syrians and percentage of population currently divorced or separated in the United States with a correlation coefficient (R) of 0.285 and weighted average of 11.7%, a difference of 2.1%.
Divorced or Separated Correlation Summary
| Measurement | Swiss | Syrian |
| Minimum | 3.3% | 4.2% |
| Maximum | 40.9% | 30.2% |
| Range | 37.6% | 26.0% |
| Mean | 11.9% | 13.2% |
| Median | 11.0% | 12.0% |
| Interquartile 25% (IQ1) | 8.5% | 9.3% |
| Interquartile 75% (IQ3) | 12.4% | 13.6% |
| Interquartile Range (IQR) | 4.0% | 4.4% |
| Standard Deviation (Sample) | 7.0% | 6.5% |
| Standard Deviation (Population) | 6.9% | 6.4% |
Similar Demographics by Divorced or Separated
Demographics Similar to Swiss by Divorced or Separated
In terms of divorced or separated, the demographic groups most similar to Swiss are Navajo (12.0%, a difference of 0.010%), Samoan (12.0%, a difference of 0.020%), Marshallese (12.0%, a difference of 0.040%), German Russian (12.0%, a difference of 0.070%), and Immigrants from Scotland (12.0%, a difference of 0.080%).
| Demographics | Rating | Rank | Divorced or Separated |
| Immigrants | Brazil | 68.8 /100 | #157 | Good 12.0% |
| Icelanders | 66.0 /100 | #158 | Good 12.0% |
| Immigrants | Barbados | 66.0 /100 | #159 | Good 12.0% |
| Immigrants | Scotland | 65.8 /100 | #160 | Good 12.0% |
| Marshallese | 64.6 /100 | #161 | Good 12.0% |
| Samoans | 64.3 /100 | #162 | Good 12.0% |
| Navajo | 63.9 /100 | #163 | Good 12.0% |
| Swiss | 63.6 /100 | #164 | Good 12.0% |
| German Russians | 61.8 /100 | #165 | Good 12.0% |
| Tohono O'odham | 60.4 /100 | #166 | Good 12.0% |
| Ethiopians | 58.5 /100 | #167 | Average 12.0% |
| Serbians | 57.1 /100 | #168 | Average 12.0% |
| Immigrants | Peru | 57.0 /100 | #169 | Average 12.0% |
| Mexican American Indians | 55.8 /100 | #170 | Average 12.0% |
| Costa Ricans | 53.3 /100 | #171 | Average 12.0% |
Demographics Similar to Syrians by Divorced or Separated
In terms of divorced or separated, the demographic groups most similar to Syrians are Ecuadorian (11.7%, a difference of 0.040%), Immigrants from Uganda (11.7%, a difference of 0.050%), Immigrants from Iraq (11.7%, a difference of 0.060%), Iraqi (11.8%, a difference of 0.090%), and Romanian (11.8%, a difference of 0.10%).
| Demographics | Rating | Rank | Divorced or Separated |
| Immigrants | France | 96.6 /100 | #112 | Exceptional 11.7% |
| Estonians | 96.6 /100 | #113 | Exceptional 11.7% |
| Immigrants | Norway | 95.9 /100 | #114 | Exceptional 11.7% |
| Lithuanians | 95.7 /100 | #115 | Exceptional 11.7% |
| Immigrants | Iraq | 95.4 /100 | #116 | Exceptional 11.7% |
| Immigrants | Uganda | 95.3 /100 | #117 | Exceptional 11.7% |
| Ecuadorians | 95.3 /100 | #118 | Exceptional 11.7% |
| Syrians | 95.1 /100 | #119 | Exceptional 11.7% |
| Iraqis | 94.6 /100 | #120 | Exceptional 11.8% |
| Romanians | 94.5 /100 | #121 | Exceptional 11.8% |
| Menominee | 93.8 /100 | #122 | Exceptional 11.8% |
| Immigrants | Immigrants | 93.7 /100 | #123 | Exceptional 11.8% |
| Ugandans | 93.1 /100 | #124 | Exceptional 11.8% |
| Ukrainians | 92.3 /100 | #125 | Exceptional 11.8% |
| South American Indians | 92.1 /100 | #126 | Exceptional 11.8% |