Crow vs Immigrants from Kazakhstan Divorced or Separated
COMPARE
Crow
Immigrants from Kazakhstan
Divorced or Separated
Divorced or Separated Comparison
Crow
Immigrants from Kazakhstan
14.1%
DIVORCED OR SEPARATED
0.0/ 100
METRIC RATING
337th/ 347
METRIC RANK
11.7%
DIVORCED OR SEPARATED
97.8/ 100
METRIC RATING
106th/ 347
METRIC RANK
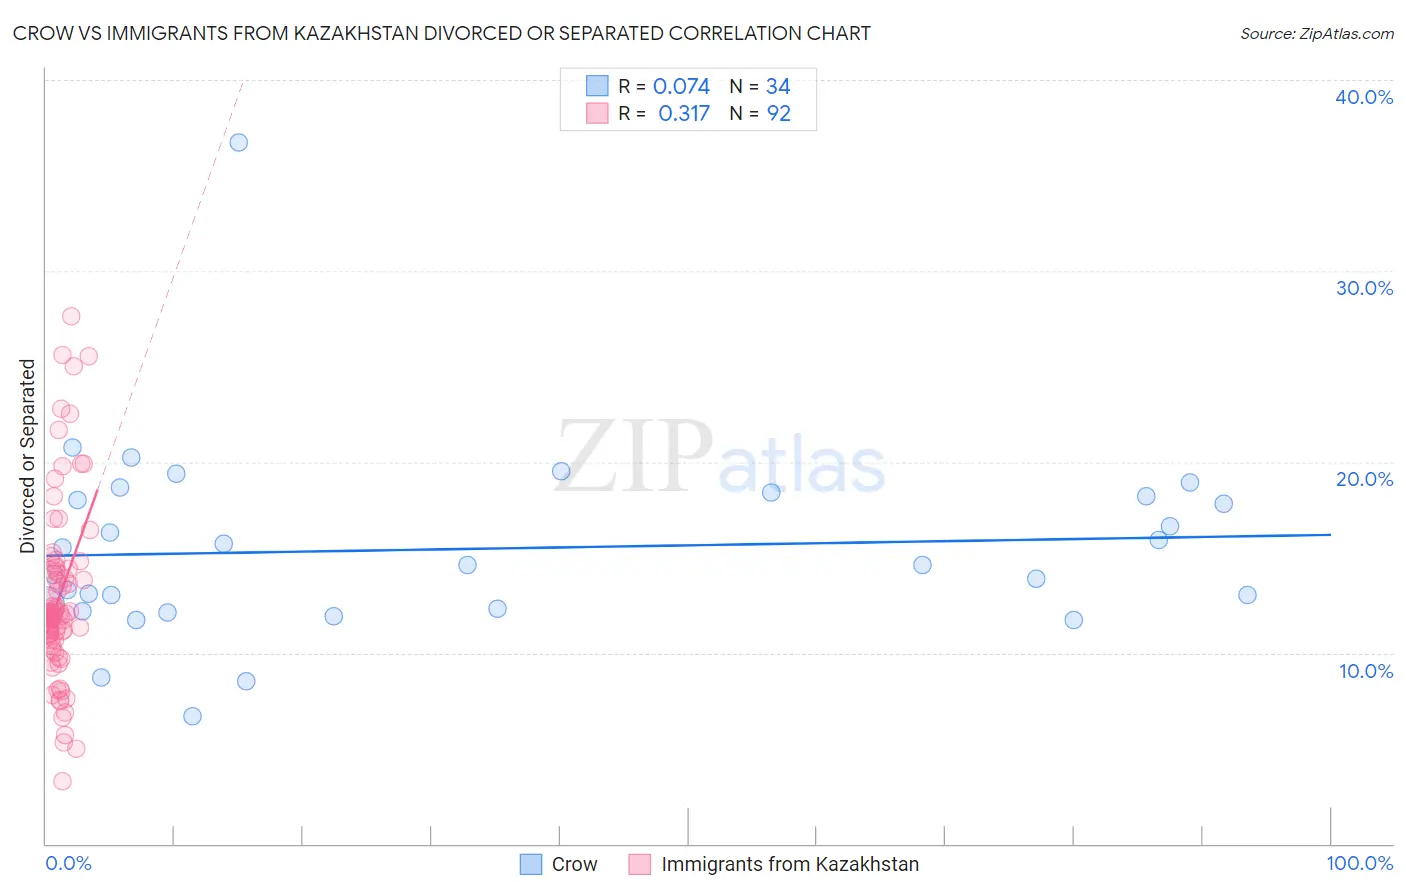
Crow vs Immigrants from Kazakhstan Divorced or Separated Correlation Chart
The statistical analysis conducted on geographies consisting of 59,208,993 people shows a slight positive correlation between the proportion of Crow and percentage of population currently divorced or separated in the United States with a correlation coefficient (R) of 0.074 and weighted average of 14.1%. Similarly, the statistical analysis conducted on geographies consisting of 124,441,918 people shows a mild positive correlation between the proportion of Immigrants from Kazakhstan and percentage of population currently divorced or separated in the United States with a correlation coefficient (R) of 0.317 and weighted average of 11.7%, a difference of 20.8%.
Divorced or Separated Correlation Summary
| Measurement | Crow | Immigrants from Kazakhstan |
| Minimum | 6.7% | 3.3% |
| Maximum | 36.7% | 27.6% |
| Range | 30.0% | 24.3% |
| Mean | 15.4% | 12.8% |
| Median | 14.6% | 12.0% |
| Interquartile 25% (IQ1) | 12.3% | 10.7% |
| Interquartile 75% (IQ3) | 18.2% | 14.3% |
| Interquartile Range (IQR) | 5.9% | 3.6% |
| Standard Deviation (Sample) | 5.1% | 4.6% |
| Standard Deviation (Population) | 5.1% | 4.6% |
Similar Demographics by Divorced or Separated
Demographics Similar to Crow by Divorced or Separated
In terms of divorced or separated, the demographic groups most similar to Crow are Shoshone (14.0%, a difference of 0.28%), Choctaw (14.1%, a difference of 0.31%), Dutch West Indian (14.0%, a difference of 0.63%), Colville (14.2%, a difference of 0.84%), and Chickasaw (14.2%, a difference of 0.88%).
| Demographics | Rating | Rank | Divorced or Separated |
| Paiute | 0.0 /100 | #330 | Tragic 13.6% |
| Blacks/African Americans | 0.0 /100 | #331 | Tragic 13.6% |
| Cherokee | 0.0 /100 | #332 | Tragic 13.7% |
| Puerto Ricans | 0.0 /100 | #333 | Tragic 13.9% |
| Immigrants | Bahamas | 0.0 /100 | #334 | Tragic 13.9% |
| Dutch West Indians | 0.0 /100 | #335 | Tragic 14.0% |
| Shoshone | 0.0 /100 | #336 | Tragic 14.0% |
| Crow | 0.0 /100 | #337 | Tragic 14.1% |
| Choctaw | 0.0 /100 | #338 | Tragic 14.1% |
| Colville | 0.0 /100 | #339 | Tragic 14.2% |
| Chickasaw | 0.0 /100 | #340 | Tragic 14.2% |
| Bahamians | 0.0 /100 | #341 | Tragic 14.2% |
| Seminole | 0.0 /100 | #342 | Tragic 14.3% |
| Creek | 0.0 /100 | #343 | Tragic 14.4% |
| Cubans | 0.0 /100 | #344 | Tragic 14.5% |
Demographics Similar to Immigrants from Kazakhstan by Divorced or Separated
In terms of divorced or separated, the demographic groups most similar to Immigrants from Kazakhstan are Immigrants from El Salvador (11.7%, a difference of 0.040%), Salvadoran (11.6%, a difference of 0.16%), Maltese (11.6%, a difference of 0.18%), Native Hawaiian (11.7%, a difference of 0.21%), and Immigrants from Croatia (11.6%, a difference of 0.22%).
| Demographics | Rating | Rank | Divorced or Separated |
| Immigrants | Sweden | 98.6 /100 | #99 | Exceptional 11.6% |
| Immigrants | Northern Europe | 98.6 /100 | #100 | Exceptional 11.6% |
| Immigrants | Guyana | 98.5 /100 | #101 | Exceptional 11.6% |
| Immigrants | Croatia | 98.3 /100 | #102 | Exceptional 11.6% |
| Maltese | 98.2 /100 | #103 | Exceptional 11.6% |
| Salvadorans | 98.2 /100 | #104 | Exceptional 11.6% |
| Immigrants | El Salvador | 97.9 /100 | #105 | Exceptional 11.7% |
| Immigrants | Kazakhstan | 97.8 /100 | #106 | Exceptional 11.7% |
| Native Hawaiians | 97.2 /100 | #107 | Exceptional 11.7% |
| Greeks | 96.9 /100 | #108 | Exceptional 11.7% |
| Immigrants | South Africa | 96.9 /100 | #109 | Exceptional 11.7% |
| Immigrants | Czechoslovakia | 96.9 /100 | #110 | Exceptional 11.7% |
| Immigrants | Spain | 96.8 /100 | #111 | Exceptional 11.7% |
| Immigrants | France | 96.6 /100 | #112 | Exceptional 11.7% |
| Estonians | 96.6 /100 | #113 | Exceptional 11.7% |