Crow vs Ute Divorced or Separated
COMPARE
Crow
Ute
Divorced or Separated
Divorced or Separated Comparison
Crow
Ute
14.1%
DIVORCED OR SEPARATED
0.0/ 100
METRIC RATING
337th/ 347
METRIC RANK
12.6%
DIVORCED OR SEPARATED
0.4/ 100
METRIC RATING
270th/ 347
METRIC RANK
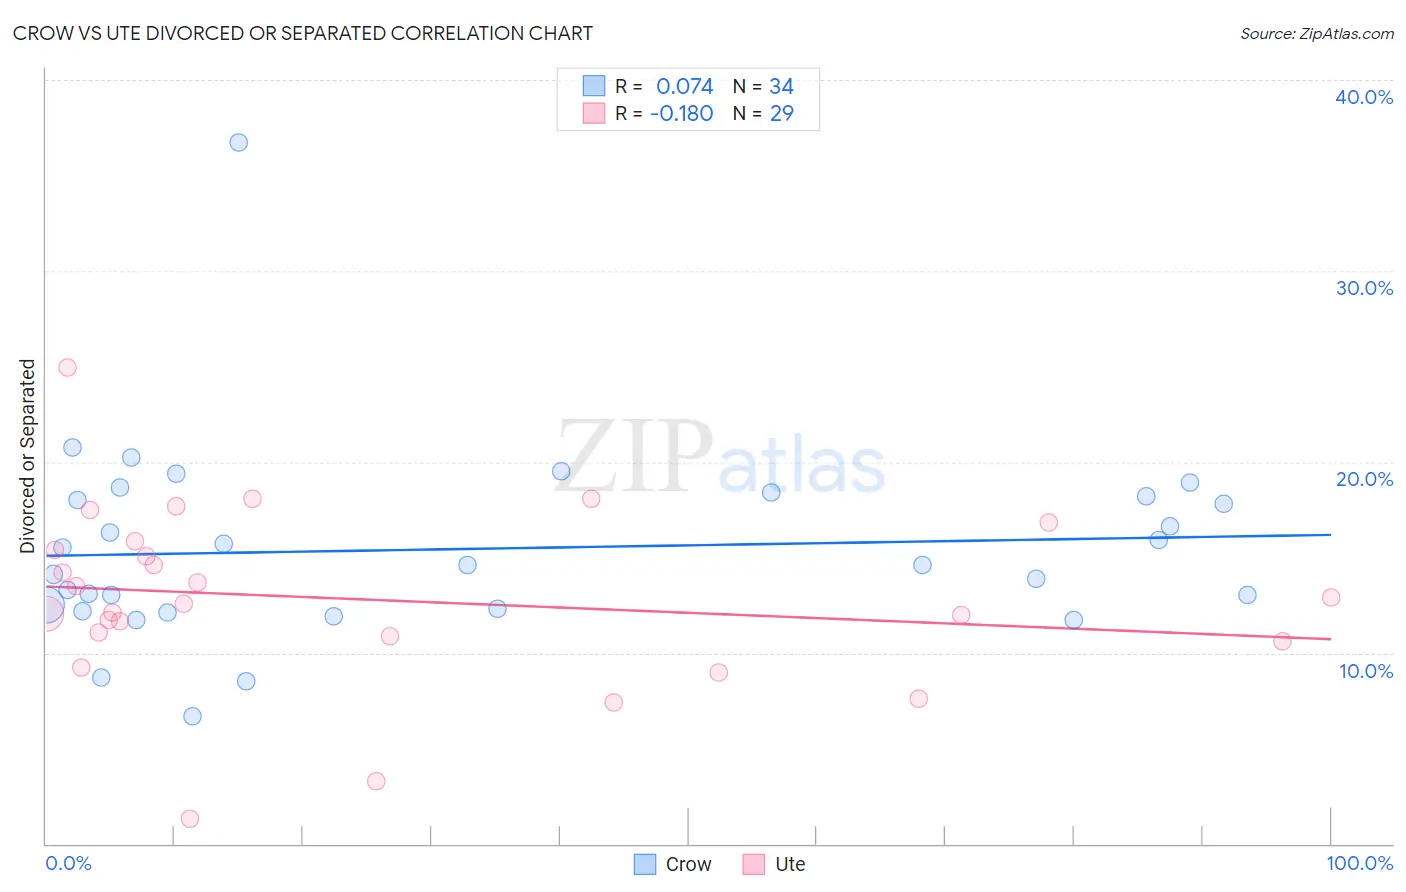
Crow vs Ute Divorced or Separated Correlation Chart
The statistical analysis conducted on geographies consisting of 59,208,993 people shows a slight positive correlation between the proportion of Crow and percentage of population currently divorced or separated in the United States with a correlation coefficient (R) of 0.074 and weighted average of 14.1%. Similarly, the statistical analysis conducted on geographies consisting of 55,667,313 people shows a poor negative correlation between the proportion of Ute and percentage of population currently divorced or separated in the United States with a correlation coefficient (R) of -0.180 and weighted average of 12.6%, a difference of 11.4%.
Divorced or Separated Correlation Summary
| Measurement | Crow | Ute |
| Minimum | 6.7% | 1.3% |
| Maximum | 36.7% | 24.9% |
| Range | 30.0% | 23.6% |
| Mean | 15.4% | 12.8% |
| Median | 14.6% | 12.6% |
| Interquartile 25% (IQ1) | 12.3% | 10.7% |
| Interquartile 75% (IQ3) | 18.2% | 15.6% |
| Interquartile Range (IQR) | 5.9% | 4.9% |
| Standard Deviation (Sample) | 5.1% | 4.7% |
| Standard Deviation (Population) | 5.1% | 4.6% |
Similar Demographics by Divorced or Separated
Demographics Similar to Crow by Divorced or Separated
In terms of divorced or separated, the demographic groups most similar to Crow are Shoshone (14.0%, a difference of 0.28%), Choctaw (14.1%, a difference of 0.31%), Dutch West Indian (14.0%, a difference of 0.63%), Colville (14.2%, a difference of 0.84%), and Chickasaw (14.2%, a difference of 0.88%).
| Demographics | Rating | Rank | Divorced or Separated |
| Paiute | 0.0 /100 | #330 | Tragic 13.6% |
| Blacks/African Americans | 0.0 /100 | #331 | Tragic 13.6% |
| Cherokee | 0.0 /100 | #332 | Tragic 13.7% |
| Puerto Ricans | 0.0 /100 | #333 | Tragic 13.9% |
| Immigrants | Bahamas | 0.0 /100 | #334 | Tragic 13.9% |
| Dutch West Indians | 0.0 /100 | #335 | Tragic 14.0% |
| Shoshone | 0.0 /100 | #336 | Tragic 14.0% |
| Crow | 0.0 /100 | #337 | Tragic 14.1% |
| Choctaw | 0.0 /100 | #338 | Tragic 14.1% |
| Colville | 0.0 /100 | #339 | Tragic 14.2% |
| Chickasaw | 0.0 /100 | #340 | Tragic 14.2% |
| Bahamians | 0.0 /100 | #341 | Tragic 14.2% |
| Seminole | 0.0 /100 | #342 | Tragic 14.3% |
| Creek | 0.0 /100 | #343 | Tragic 14.4% |
| Cubans | 0.0 /100 | #344 | Tragic 14.5% |
Demographics Similar to Ute by Divorced or Separated
In terms of divorced or separated, the demographic groups most similar to Ute are Panamanian (12.7%, a difference of 0.060%), Immigrants from Middle Africa (12.7%, a difference of 0.11%), Immigrants from Liberia (12.6%, a difference of 0.12%), Fijian (12.6%, a difference of 0.13%), and Scottish (12.6%, a difference of 0.14%).
| Demographics | Rating | Rank | Divorced or Separated |
| Immigrants | Panama | 0.5 /100 | #263 | Tragic 12.6% |
| English | 0.5 /100 | #264 | Tragic 12.6% |
| Immigrants | Senegal | 0.5 /100 | #265 | Tragic 12.6% |
| Whites/Caucasians | 0.5 /100 | #266 | Tragic 12.6% |
| Scottish | 0.4 /100 | #267 | Tragic 12.6% |
| Fijians | 0.4 /100 | #268 | Tragic 12.6% |
| Immigrants | Liberia | 0.4 /100 | #269 | Tragic 12.6% |
| Ute | 0.4 /100 | #270 | Tragic 12.6% |
| Panamanians | 0.3 /100 | #271 | Tragic 12.7% |
| Immigrants | Middle Africa | 0.3 /100 | #272 | Tragic 12.7% |
| Immigrants | Micronesia | 0.3 /100 | #273 | Tragic 12.7% |
| Bermudans | 0.3 /100 | #274 | Tragic 12.7% |
| Central American Indians | 0.3 /100 | #275 | Tragic 12.7% |
| Spaniards | 0.2 /100 | #276 | Tragic 12.7% |
| Dominicans | 0.2 /100 | #277 | Tragic 12.7% |