Central American vs Syrian Divorced or Separated
COMPARE
Central American
Syrian
Divorced or Separated
Divorced or Separated Comparison
Central Americans
Syrians
12.1%
DIVORCED OR SEPARATED
29.4/ 100
METRIC RATING
199th/ 347
METRIC RANK
11.7%
DIVORCED OR SEPARATED
95.1/ 100
METRIC RATING
119th/ 347
METRIC RANK
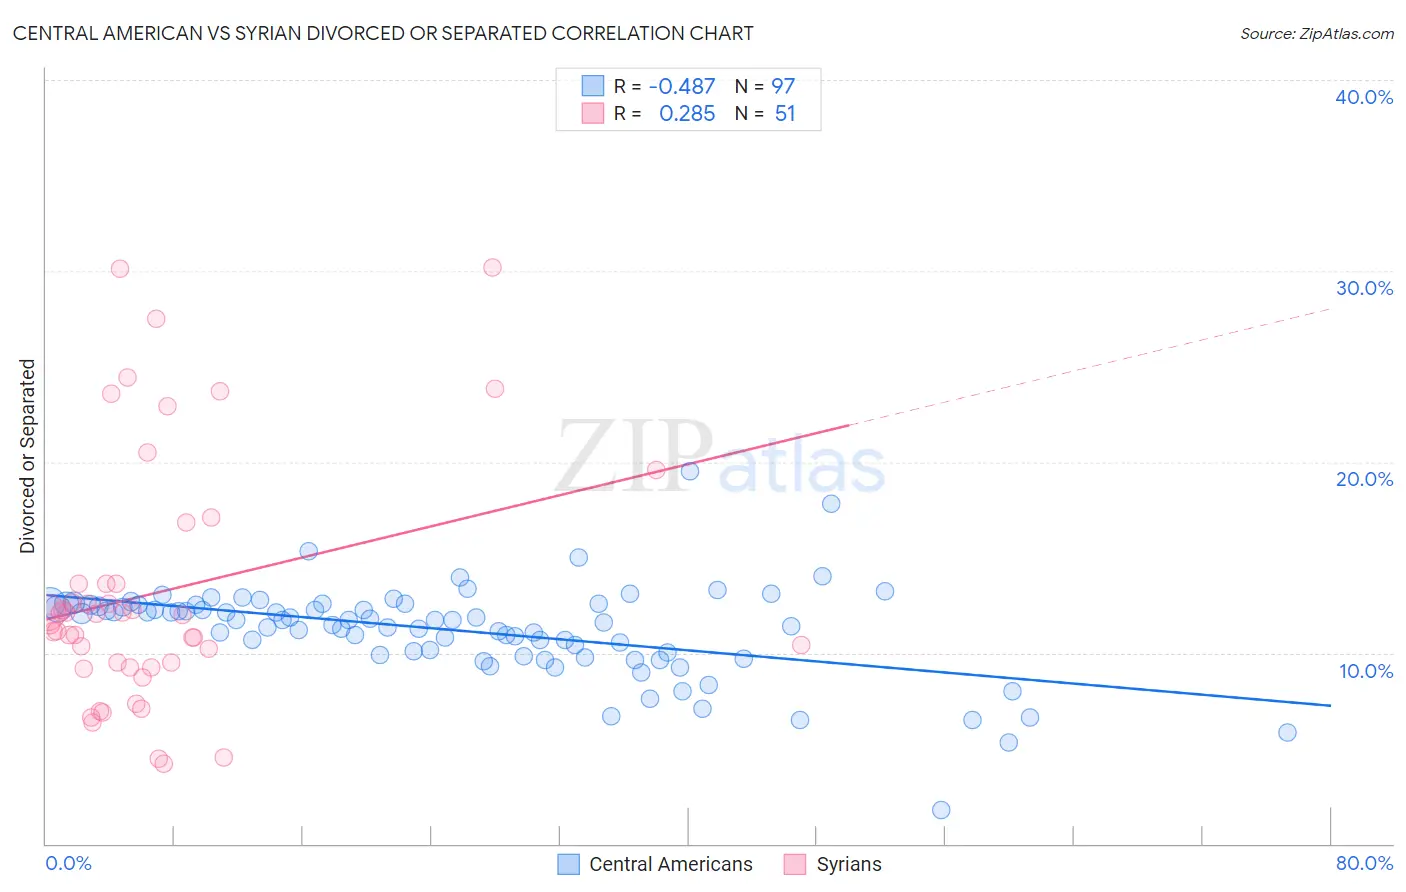
Central American vs Syrian Divorced or Separated Correlation Chart
The statistical analysis conducted on geographies consisting of 504,272,627 people shows a moderate negative correlation between the proportion of Central Americans and percentage of population currently divorced or separated in the United States with a correlation coefficient (R) of -0.487 and weighted average of 12.1%. Similarly, the statistical analysis conducted on geographies consisting of 266,220,944 people shows a weak positive correlation between the proportion of Syrians and percentage of population currently divorced or separated in the United States with a correlation coefficient (R) of 0.285 and weighted average of 11.7%, a difference of 3.4%.
Divorced or Separated Correlation Summary
| Measurement | Central American | Syrian |
| Minimum | 1.8% | 4.2% |
| Maximum | 19.5% | 30.2% |
| Range | 17.7% | 26.0% |
| Mean | 11.2% | 13.2% |
| Median | 11.7% | 12.0% |
| Interquartile 25% (IQ1) | 9.9% | 9.3% |
| Interquartile 75% (IQ3) | 12.5% | 13.6% |
| Interquartile Range (IQR) | 2.6% | 4.4% |
| Standard Deviation (Sample) | 2.4% | 6.5% |
| Standard Deviation (Population) | 2.4% | 6.4% |
Similar Demographics by Divorced or Separated
Demographics Similar to Central Americans by Divorced or Separated
In terms of divorced or separated, the demographic groups most similar to Central Americans are Nigerian (12.1%, a difference of 0.030%), South American (12.2%, a difference of 0.030%), Immigrants from Burma/Myanmar (12.1%, a difference of 0.040%), Immigrants from Africa (12.1%, a difference of 0.040%), and Immigrants from England (12.1%, a difference of 0.080%).
| Demographics | Rating | Rank | Divorced or Separated |
| Norwegians | 33.2 /100 | #192 | Fair 12.1% |
| Immigrants | Thailand | 32.5 /100 | #193 | Fair 12.1% |
| Immigrants | Eritrea | 31.9 /100 | #194 | Fair 12.1% |
| Immigrants | England | 31.4 /100 | #195 | Fair 12.1% |
| Immigrants | Burma/Myanmar | 30.4 /100 | #196 | Fair 12.1% |
| Immigrants | Africa | 30.3 /100 | #197 | Fair 12.1% |
| Nigerians | 30.1 /100 | #198 | Fair 12.1% |
| Central Americans | 29.4 /100 | #199 | Fair 12.1% |
| South Americans | 28.6 /100 | #200 | Fair 12.2% |
| Guatemalans | 26.9 /100 | #201 | Fair 12.2% |
| Portuguese | 23.5 /100 | #202 | Fair 12.2% |
| Immigrants | Guatemala | 23.2 /100 | #203 | Fair 12.2% |
| Kenyans | 21.8 /100 | #204 | Fair 12.2% |
| Immigrants | Costa Rica | 21.3 /100 | #205 | Fair 12.2% |
| Slovaks | 21.0 /100 | #206 | Fair 12.2% |
Demographics Similar to Syrians by Divorced or Separated
In terms of divorced or separated, the demographic groups most similar to Syrians are Ecuadorian (11.7%, a difference of 0.040%), Immigrants from Uganda (11.7%, a difference of 0.050%), Immigrants from Iraq (11.7%, a difference of 0.060%), Iraqi (11.8%, a difference of 0.090%), and Romanian (11.8%, a difference of 0.10%).
| Demographics | Rating | Rank | Divorced or Separated |
| Immigrants | France | 96.6 /100 | #112 | Exceptional 11.7% |
| Estonians | 96.6 /100 | #113 | Exceptional 11.7% |
| Immigrants | Norway | 95.9 /100 | #114 | Exceptional 11.7% |
| Lithuanians | 95.7 /100 | #115 | Exceptional 11.7% |
| Immigrants | Iraq | 95.4 /100 | #116 | Exceptional 11.7% |
| Immigrants | Uganda | 95.3 /100 | #117 | Exceptional 11.7% |
| Ecuadorians | 95.3 /100 | #118 | Exceptional 11.7% |
| Syrians | 95.1 /100 | #119 | Exceptional 11.7% |
| Iraqis | 94.6 /100 | #120 | Exceptional 11.8% |
| Romanians | 94.5 /100 | #121 | Exceptional 11.8% |
| Menominee | 93.8 /100 | #122 | Exceptional 11.8% |
| Immigrants | Immigrants | 93.7 /100 | #123 | Exceptional 11.8% |
| Ugandans | 93.1 /100 | #124 | Exceptional 11.8% |
| Ukrainians | 92.3 /100 | #125 | Exceptional 11.8% |
| South American Indians | 92.1 /100 | #126 | Exceptional 11.8% |