Crow vs Celtic Divorced or Separated
COMPARE
Crow
Celtic
Divorced or Separated
Divorced or Separated Comparison
Crow
Celtics
14.1%
DIVORCED OR SEPARATED
0.0/ 100
METRIC RATING
337th/ 347
METRIC RANK
13.0%
DIVORCED OR SEPARATED
0.0/ 100
METRIC RATING
295th/ 347
METRIC RANK
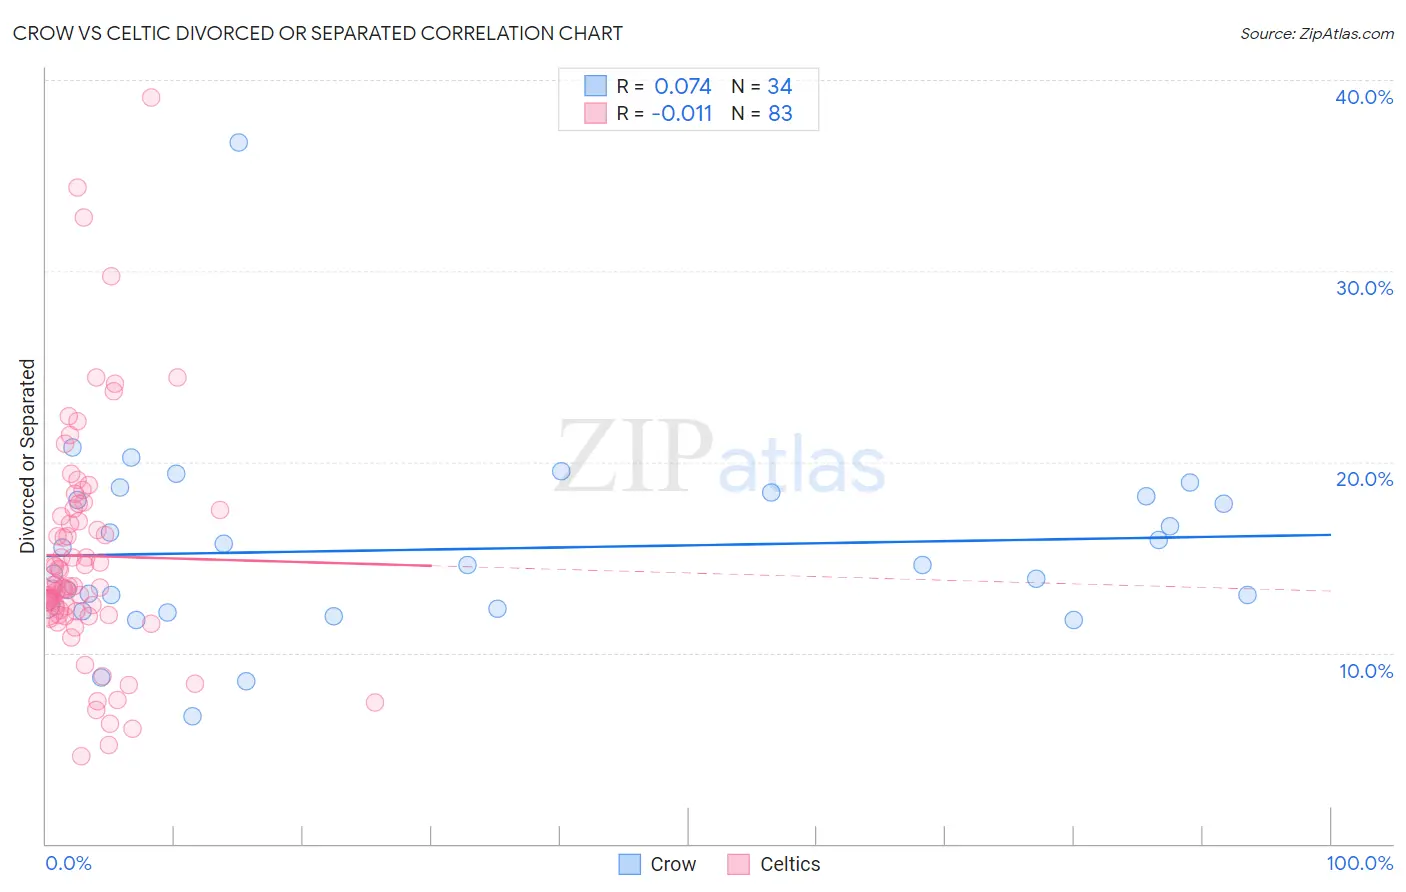
Crow vs Celtic Divorced or Separated Correlation Chart
The statistical analysis conducted on geographies consisting of 59,208,993 people shows a slight positive correlation between the proportion of Crow and percentage of population currently divorced or separated in the United States with a correlation coefficient (R) of 0.074 and weighted average of 14.1%. Similarly, the statistical analysis conducted on geographies consisting of 168,870,662 people shows no correlation between the proportion of Celtics and percentage of population currently divorced or separated in the United States with a correlation coefficient (R) of -0.011 and weighted average of 13.0%, a difference of 8.7%.
Divorced or Separated Correlation Summary
| Measurement | Crow | Celtic |
| Minimum | 6.7% | 4.6% |
| Maximum | 36.7% | 39.1% |
| Range | 30.0% | 34.5% |
| Mean | 15.4% | 15.1% |
| Median | 14.6% | 13.5% |
| Interquartile 25% (IQ1) | 12.3% | 12.0% |
| Interquartile 75% (IQ3) | 18.2% | 17.5% |
| Interquartile Range (IQR) | 5.9% | 5.5% |
| Standard Deviation (Sample) | 5.1% | 6.1% |
| Standard Deviation (Population) | 5.1% | 6.1% |
Similar Demographics by Divorced or Separated
Demographics Similar to Crow by Divorced or Separated
In terms of divorced or separated, the demographic groups most similar to Crow are Shoshone (14.0%, a difference of 0.28%), Choctaw (14.1%, a difference of 0.31%), Dutch West Indian (14.0%, a difference of 0.63%), Colville (14.2%, a difference of 0.84%), and Chickasaw (14.2%, a difference of 0.88%).
| Demographics | Rating | Rank | Divorced or Separated |
| Paiute | 0.0 /100 | #330 | Tragic 13.6% |
| Blacks/African Americans | 0.0 /100 | #331 | Tragic 13.6% |
| Cherokee | 0.0 /100 | #332 | Tragic 13.7% |
| Puerto Ricans | 0.0 /100 | #333 | Tragic 13.9% |
| Immigrants | Bahamas | 0.0 /100 | #334 | Tragic 13.9% |
| Dutch West Indians | 0.0 /100 | #335 | Tragic 14.0% |
| Shoshone | 0.0 /100 | #336 | Tragic 14.0% |
| Crow | 0.0 /100 | #337 | Tragic 14.1% |
| Choctaw | 0.0 /100 | #338 | Tragic 14.1% |
| Colville | 0.0 /100 | #339 | Tragic 14.2% |
| Chickasaw | 0.0 /100 | #340 | Tragic 14.2% |
| Bahamians | 0.0 /100 | #341 | Tragic 14.2% |
| Seminole | 0.0 /100 | #342 | Tragic 14.3% |
| Creek | 0.0 /100 | #343 | Tragic 14.4% |
| Cubans | 0.0 /100 | #344 | Tragic 14.5% |
Demographics Similar to Celtics by Divorced or Separated
In terms of divorced or separated, the demographic groups most similar to Celtics are Apache (12.9%, a difference of 0.13%), Jamaican (12.9%, a difference of 0.16%), Scotch-Irish (12.9%, a difference of 0.37%), Nicaraguan (13.0%, a difference of 0.41%), and Immigrants from Honduras (12.9%, a difference of 0.42%).
| Demographics | Rating | Rank | Divorced or Separated |
| French Canadians | 0.1 /100 | #288 | Tragic 12.8% |
| Iroquois | 0.0 /100 | #289 | Tragic 12.9% |
| Pima | 0.0 /100 | #290 | Tragic 12.9% |
| Immigrants | Honduras | 0.0 /100 | #291 | Tragic 12.9% |
| Scotch-Irish | 0.0 /100 | #292 | Tragic 12.9% |
| Jamaicans | 0.0 /100 | #293 | Tragic 12.9% |
| Apache | 0.0 /100 | #294 | Tragic 12.9% |
| Celtics | 0.0 /100 | #295 | Tragic 13.0% |
| Nicaraguans | 0.0 /100 | #296 | Tragic 13.0% |
| Natives/Alaskans | 0.0 /100 | #297 | Tragic 13.0% |
| Venezuelans | 0.0 /100 | #298 | Tragic 13.0% |
| Immigrants | Jamaica | 0.0 /100 | #299 | Tragic 13.0% |
| Immigrants | Cabo Verde | 0.0 /100 | #300 | Tragic 13.1% |
| Alaskan Athabascans | 0.0 /100 | #301 | Tragic 13.1% |
| Immigrants | Venezuela | 0.0 /100 | #302 | Tragic 13.1% |