Crow vs Mongolian Child Poverty Among Boys Under 16
COMPARE
Crow
Mongolian
Child Poverty Among Boys Under 16
Child Poverty Among Boys Under 16 Comparison
Crow
Mongolians
26.3%
CHILD POVERTY AMONG BOYS UNDER 16
0.0/ 100
METRIC RATING
340th/ 347
METRIC RANK
15.4%
CHILD POVERTY AMONG BOYS UNDER 16
90.2/ 100
METRIC RATING
130th/ 347
METRIC RANK
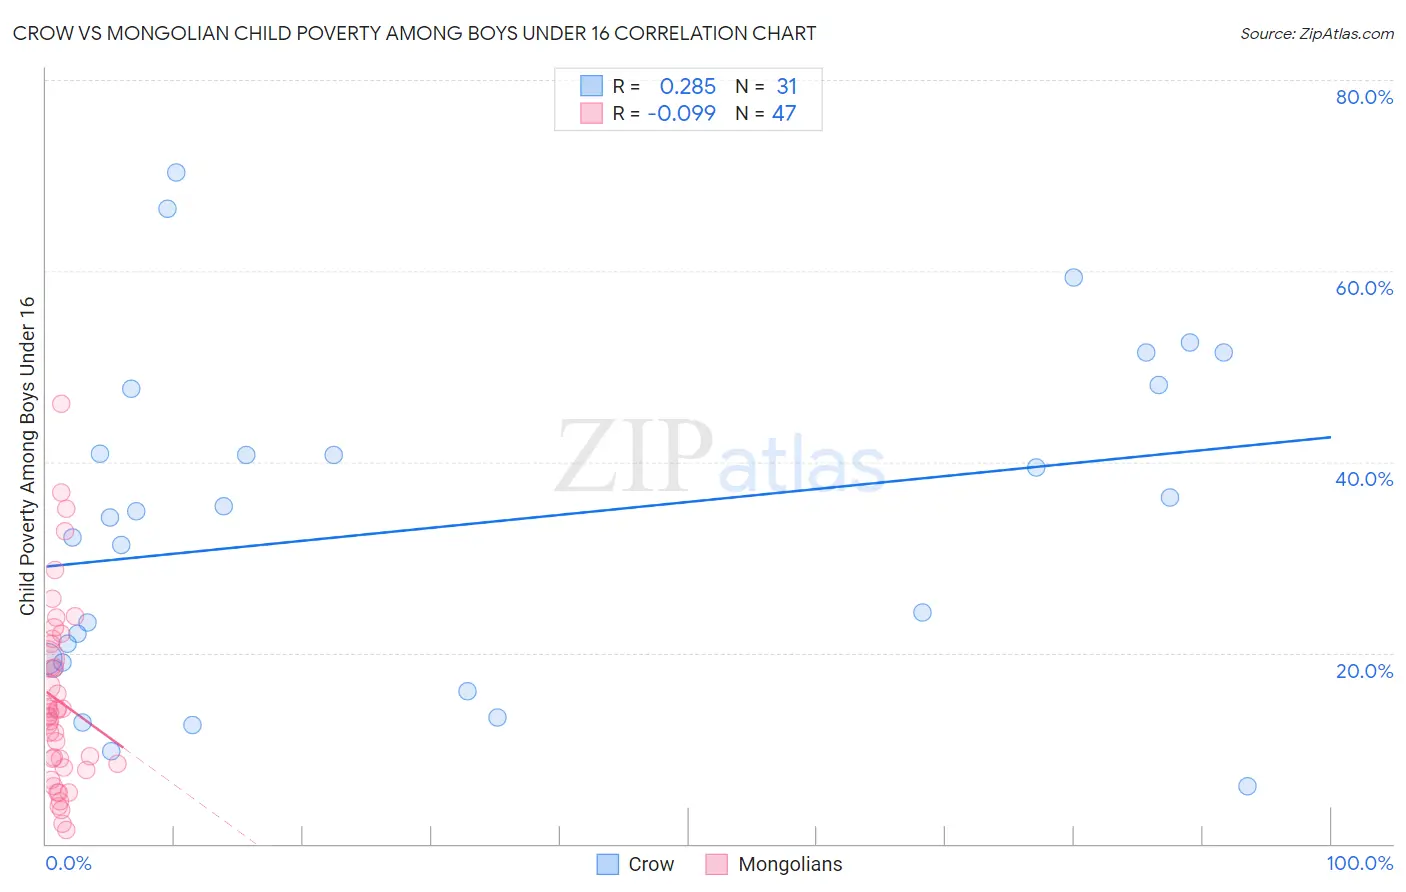
Crow vs Mongolian Child Poverty Among Boys Under 16 Correlation Chart
The statistical analysis conducted on geographies consisting of 59,088,191 people shows a weak positive correlation between the proportion of Crow and poverty level among boys under the age of 16 in the United States with a correlation coefficient (R) of 0.285 and weighted average of 26.3%. Similarly, the statistical analysis conducted on geographies consisting of 139,635,947 people shows a slight negative correlation between the proportion of Mongolians and poverty level among boys under the age of 16 in the United States with a correlation coefficient (R) of -0.099 and weighted average of 15.4%, a difference of 70.3%.
Child Poverty Among Boys Under 16 Correlation Summary
| Measurement | Crow | Mongolian |
| Minimum | 6.1% | 1.5% |
| Maximum | 70.3% | 46.2% |
| Range | 64.2% | 44.7% |
| Mean | 33.2% | 15.0% |
| Median | 34.2% | 13.4% |
| Interquartile 25% (IQ1) | 19.0% | 7.9% |
| Interquartile 75% (IQ3) | 47.6% | 21.0% |
| Interquartile Range (IQR) | 28.6% | 13.1% |
| Standard Deviation (Sample) | 17.1% | 9.7% |
| Standard Deviation (Population) | 16.8% | 9.6% |
Similar Demographics by Child Poverty Among Boys Under 16
Demographics Similar to Crow by Child Poverty Among Boys Under 16
In terms of child poverty among boys under 16, the demographic groups most similar to Crow are Houma (26.2%, a difference of 0.16%), Hopi (25.9%, a difference of 1.2%), Cheyenne (25.8%, a difference of 1.7%), Sioux (25.3%, a difference of 3.8%), and Yup'ik (24.7%, a difference of 6.1%).
| Demographics | Rating | Rank | Child Poverty Among Boys Under 16 |
| Apache | 0.0 /100 | #333 | Tragic 24.5% |
| Blacks/African Americans | 0.0 /100 | #334 | Tragic 24.5% |
| Yup'ik | 0.0 /100 | #335 | Tragic 24.7% |
| Sioux | 0.0 /100 | #336 | Tragic 25.3% |
| Cheyenne | 0.0 /100 | #337 | Tragic 25.8% |
| Hopi | 0.0 /100 | #338 | Tragic 25.9% |
| Houma | 0.0 /100 | #339 | Tragic 26.2% |
| Crow | 0.0 /100 | #340 | Tragic 26.3% |
| Immigrants | Yemen | 0.0 /100 | #341 | Tragic 28.9% |
| Pima | 0.0 /100 | #342 | Tragic 29.7% |
| Navajo | 0.0 /100 | #343 | Tragic 30.3% |
| Yuman | 0.0 /100 | #344 | Tragic 30.6% |
| Tohono O'odham | 0.0 /100 | #345 | Tragic 31.6% |
| Lumbee | 0.0 /100 | #346 | Tragic 31.9% |
| Puerto Ricans | 0.0 /100 | #347 | Tragic 32.8% |
Demographics Similar to Mongolians by Child Poverty Among Boys Under 16
In terms of child poverty among boys under 16, the demographic groups most similar to Mongolians are Immigrants from Brazil (15.4%, a difference of 0.020%), Immigrants from Western Europe (15.4%, a difference of 0.060%), Canadian (15.4%, a difference of 0.14%), Carpatho Rusyn (15.4%, a difference of 0.33%), and Palestinian (15.4%, a difference of 0.38%).
| Demographics | Rating | Rank | Child Poverty Among Boys Under 16 |
| Immigrants | Norway | 92.3 /100 | #123 | Exceptional 15.3% |
| Tlingit-Haida | 92.2 /100 | #124 | Exceptional 15.3% |
| Czechoslovakians | 92.1 /100 | #125 | Exceptional 15.3% |
| Palestinians | 91.3 /100 | #126 | Exceptional 15.4% |
| Carpatho Rusyns | 91.1 /100 | #127 | Exceptional 15.4% |
| Canadians | 90.6 /100 | #128 | Exceptional 15.4% |
| Immigrants | Brazil | 90.3 /100 | #129 | Exceptional 15.4% |
| Mongolians | 90.2 /100 | #130 | Exceptional 15.4% |
| Immigrants | Western Europe | 90.0 /100 | #131 | Exceptional 15.4% |
| Immigrants | Kazakhstan | 88.7 /100 | #132 | Excellent 15.5% |
| Welsh | 88.3 /100 | #133 | Excellent 15.5% |
| Peruvians | 88.1 /100 | #134 | Excellent 15.5% |
| Portuguese | 87.5 /100 | #135 | Excellent 15.5% |
| Icelanders | 87.5 /100 | #136 | Excellent 15.5% |
| Immigrants | Spain | 87.1 /100 | #137 | Excellent 15.6% |