Crow vs Mongolian College, 1 year or more
COMPARE
Crow
Mongolian
College, 1 year or more
College, 1 year or more Comparison
Crow
Mongolians
54.5%
COLLEGE, 1 YEAR OR MORE
0.2/ 100
METRIC RATING
270th/ 347
METRIC RANK
64.8%
COLLEGE, 1 YEAR OR MORE
99.9/ 100
METRIC RATING
41st/ 347
METRIC RANK
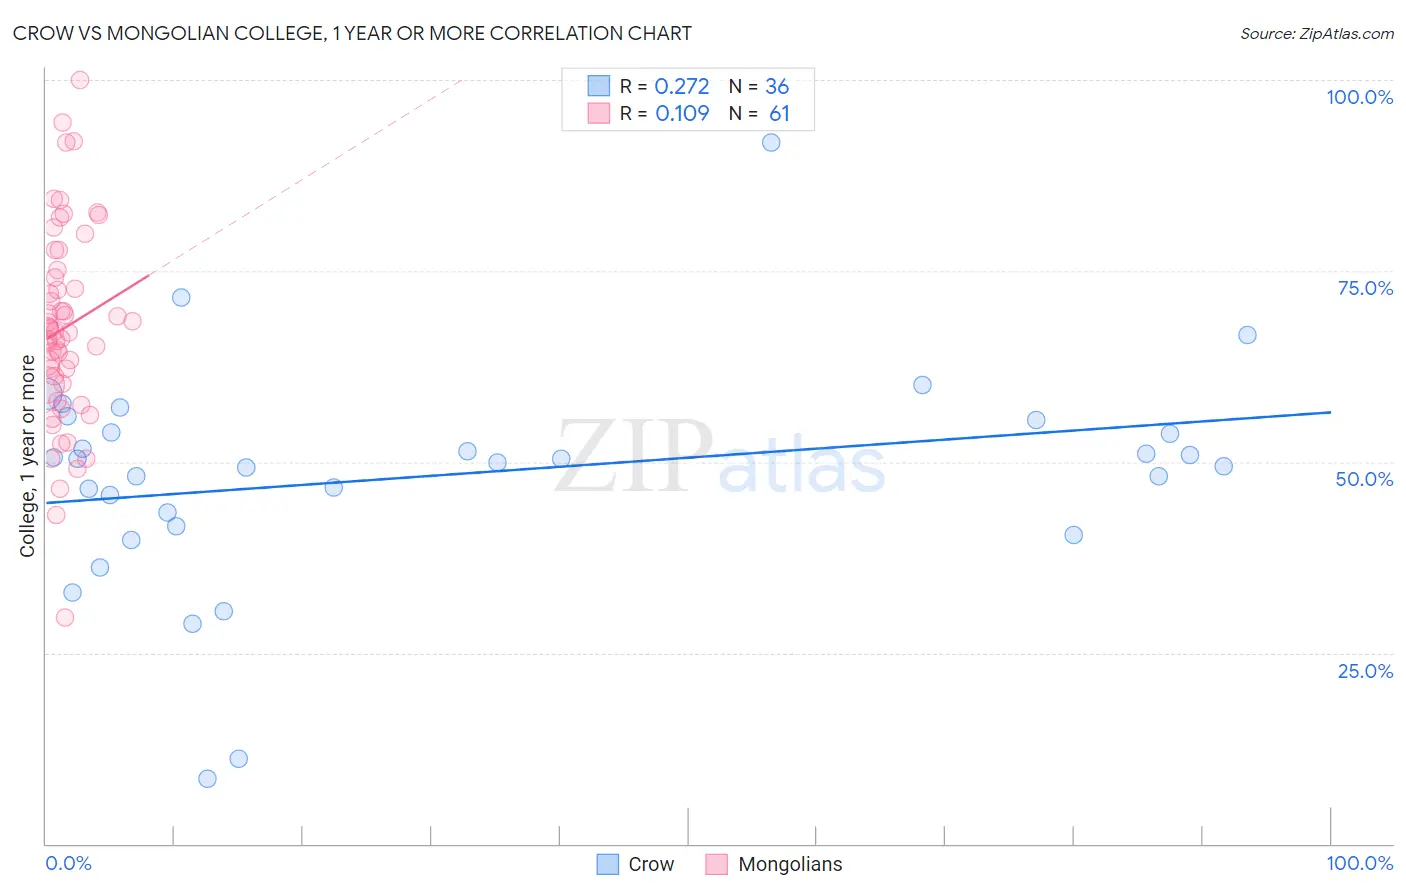
Crow vs Mongolian College, 1 year or more Correlation Chart
The statistical analysis conducted on geographies consisting of 59,209,980 people shows a weak positive correlation between the proportion of Crow and percentage of population with at least college, 1 year or more education in the United States with a correlation coefficient (R) of 0.272 and weighted average of 54.5%. Similarly, the statistical analysis conducted on geographies consisting of 140,362,004 people shows a poor positive correlation between the proportion of Mongolians and percentage of population with at least college, 1 year or more education in the United States with a correlation coefficient (R) of 0.109 and weighted average of 64.8%, a difference of 19.0%.
College, 1 year or more Correlation Summary
| Measurement | Crow | Mongolian |
| Minimum | 8.6% | 29.5% |
| Maximum | 91.8% | 100.0% |
| Range | 83.3% | 70.5% |
| Mean | 48.2% | 67.5% |
| Median | 50.2% | 67.1% |
| Interquartile 25% (IQ1) | 42.5% | 60.1% |
| Interquartile 75% (IQ3) | 54.7% | 74.6% |
| Interquartile Range (IQR) | 12.2% | 14.5% |
| Standard Deviation (Sample) | 14.8% | 12.9% |
| Standard Deviation (Population) | 14.6% | 12.8% |
Similar Demographics by College, 1 year or more
Demographics Similar to Crow by College, 1 year or more
In terms of college, 1 year or more, the demographic groups most similar to Crow are Bahamian (54.5%, a difference of 0.020%), Bangladeshi (54.5%, a difference of 0.030%), British West Indian (54.5%, a difference of 0.070%), Comanche (54.4%, a difference of 0.070%), and Immigrants from Grenada (54.4%, a difference of 0.11%).
| Demographics | Rating | Rank | College, 1 year or more |
| U.S. Virgin Islanders | 0.3 /100 | #263 | Tragic 54.8% |
| Immigrants | Micronesia | 0.3 /100 | #264 | Tragic 54.8% |
| Immigrants | Laos | 0.2 /100 | #265 | Tragic 54.7% |
| Potawatomi | 0.2 /100 | #266 | Tragic 54.6% |
| Blackfeet | 0.2 /100 | #267 | Tragic 54.6% |
| British West Indians | 0.2 /100 | #268 | Tragic 54.5% |
| Bangladeshis | 0.2 /100 | #269 | Tragic 54.5% |
| Crow | 0.2 /100 | #270 | Tragic 54.5% |
| Bahamians | 0.2 /100 | #271 | Tragic 54.5% |
| Comanche | 0.2 /100 | #272 | Tragic 54.4% |
| Immigrants | Grenada | 0.2 /100 | #273 | Tragic 54.4% |
| Belizeans | 0.2 /100 | #274 | Tragic 54.4% |
| Americans | 0.2 /100 | #275 | Tragic 54.4% |
| Shoshone | 0.2 /100 | #276 | Tragic 54.3% |
| Ecuadorians | 0.2 /100 | #277 | Tragic 54.3% |
Demographics Similar to Mongolians by College, 1 year or more
In terms of college, 1 year or more, the demographic groups most similar to Mongolians are Immigrants from Latvia (64.8%, a difference of 0.010%), Immigrants from Russia (64.7%, a difference of 0.13%), Immigrants from Norway (64.7%, a difference of 0.15%), Immigrants from Kuwait (65.0%, a difference of 0.20%), and Estonian (65.0%, a difference of 0.26%).
| Demographics | Rating | Rank | College, 1 year or more |
| Israelis | 99.9 /100 | #34 | Exceptional 65.3% |
| Immigrants | Turkey | 99.9 /100 | #35 | Exceptional 65.2% |
| Immigrants | South Africa | 99.9 /100 | #36 | Exceptional 65.1% |
| Russians | 99.9 /100 | #37 | Exceptional 65.1% |
| Immigrants | Saudi Arabia | 99.9 /100 | #38 | Exceptional 65.0% |
| Estonians | 99.9 /100 | #39 | Exceptional 65.0% |
| Immigrants | Kuwait | 99.9 /100 | #40 | Exceptional 65.0% |
| Mongolians | 99.9 /100 | #41 | Exceptional 64.8% |
| Immigrants | Latvia | 99.9 /100 | #42 | Exceptional 64.8% |
| Immigrants | Russia | 99.9 /100 | #43 | Exceptional 64.7% |
| Immigrants | Norway | 99.9 /100 | #44 | Exceptional 64.7% |
| Immigrants | Lithuania | 99.9 /100 | #45 | Exceptional 64.6% |
| Bhutanese | 99.9 /100 | #46 | Exceptional 64.6% |
| Australians | 99.9 /100 | #47 | Exceptional 64.6% |
| Immigrants | Bulgaria | 99.9 /100 | #48 | Exceptional 64.6% |