Egyptian vs Mongolian Births to Unmarried Women
COMPARE
Egyptian
Mongolian
Births to Unmarried Women
Births to Unmarried Women Comparison
Egyptians
Mongolians
28.2%
BIRTHS TO UNMARRIED WOMEN
99.0/ 100
METRIC RATING
62nd/ 347
METRIC RANK
27.9%
BIRTHS TO UNMARRIED WOMEN
99.3/ 100
METRIC RATING
55th/ 347
METRIC RANK
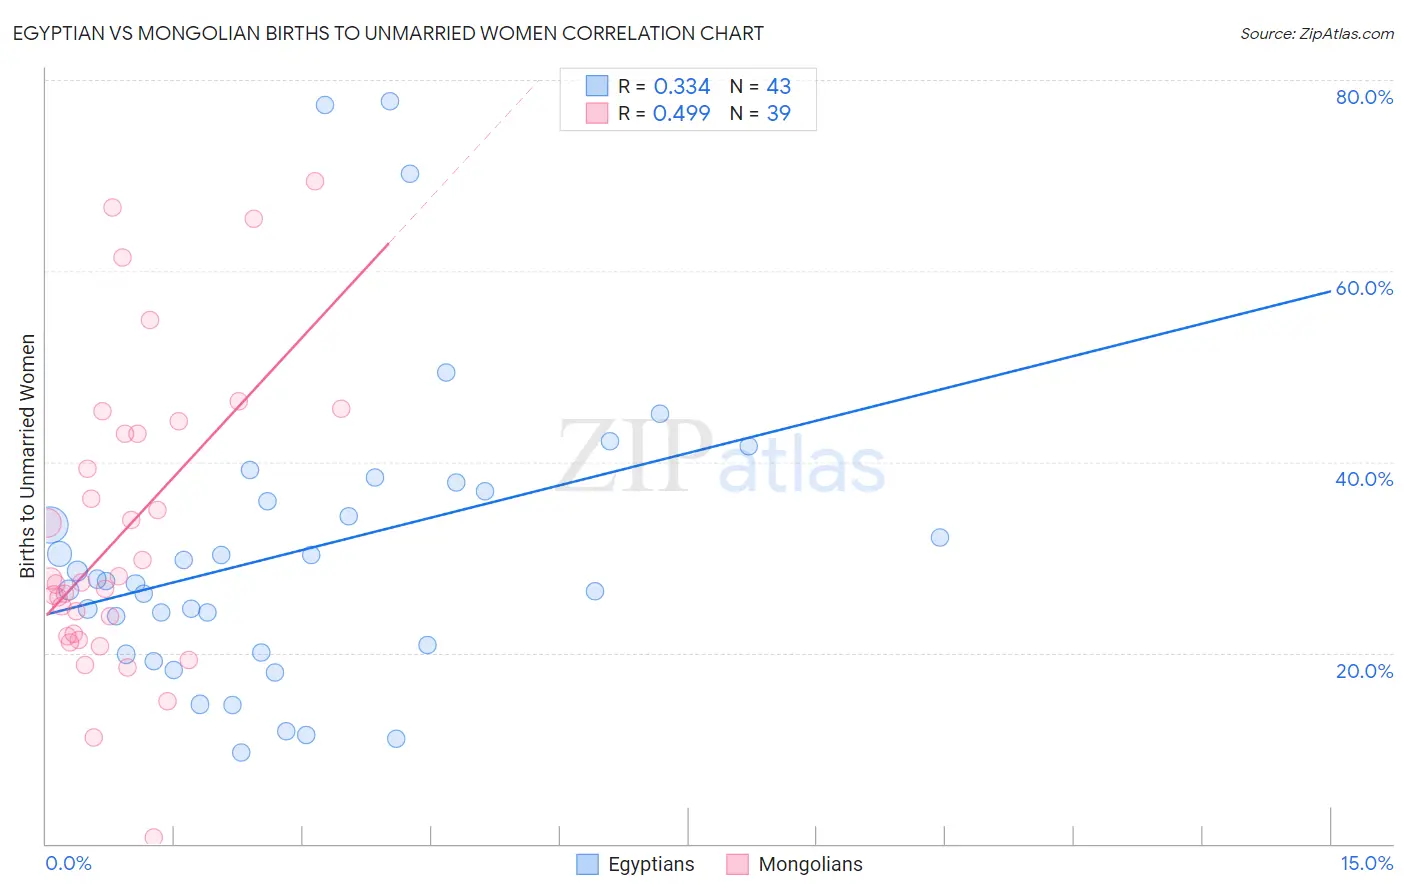
Egyptian vs Mongolian Births to Unmarried Women Correlation Chart
The statistical analysis conducted on geographies consisting of 261,953,524 people shows a mild positive correlation between the proportion of Egyptians and percentage of births to unmarried women in the United States with a correlation coefficient (R) of 0.334 and weighted average of 28.2%. Similarly, the statistical analysis conducted on geographies consisting of 135,823,191 people shows a moderate positive correlation between the proportion of Mongolians and percentage of births to unmarried women in the United States with a correlation coefficient (R) of 0.499 and weighted average of 27.9%, a difference of 1.2%.
Births to Unmarried Women Correlation Summary
| Measurement | Egyptian | Mongolian |
| Minimum | 9.6% | 0.60% |
| Maximum | 77.8% | 69.4% |
| Range | 68.2% | 68.8% |
| Mean | 30.5% | 32.6% |
| Median | 27.5% | 27.3% |
| Interquartile 25% (IQ1) | 20.0% | 21.7% |
| Interquartile 75% (IQ3) | 36.9% | 42.9% |
| Interquartile Range (IQR) | 16.9% | 21.2% |
| Standard Deviation (Sample) | 15.6% | 15.7% |
| Standard Deviation (Population) | 15.4% | 15.5% |
Demographics Similar to Egyptians and Mongolians by Births to Unmarried Women
In terms of births to unmarried women, the demographic groups most similar to Egyptians are Immigrants from Serbia (28.3%, a difference of 0.14%), Immigrants from North Macedonia (28.1%, a difference of 0.32%), Immigrants from Turkey (28.1%, a difference of 0.36%), Immigrants from Kazakhstan (28.1%, a difference of 0.41%), and Tongan (28.4%, a difference of 0.53%). Similarly, the demographic groups most similar to Mongolians are Afghan (27.9%, a difference of 0.040%), Immigrants from Romania (27.9%, a difference of 0.11%), Bhutanese (27.9%, a difference of 0.12%), Macedonian (27.9%, a difference of 0.16%), and Immigrants from Belgium (28.0%, a difference of 0.26%).
| Demographics | Rating | Rank | Births to Unmarried Women |
| Eastern Europeans | 99.5 /100 | #48 | Exceptional 27.7% |
| Immigrants | Greece | 99.4 /100 | #49 | Exceptional 27.8% |
| Maltese | 99.4 /100 | #50 | Exceptional 27.8% |
| Macedonians | 99.4 /100 | #51 | Exceptional 27.9% |
| Bhutanese | 99.4 /100 | #52 | Exceptional 27.9% |
| Immigrants | Romania | 99.4 /100 | #53 | Exceptional 27.9% |
| Afghans | 99.4 /100 | #54 | Exceptional 27.9% |
| Mongolians | 99.3 /100 | #55 | Exceptional 27.9% |
| Immigrants | Belgium | 99.3 /100 | #56 | Exceptional 28.0% |
| Russians | 99.2 /100 | #57 | Exceptional 28.0% |
| Immigrants | Albania | 99.2 /100 | #58 | Exceptional 28.0% |
| Immigrants | Kazakhstan | 99.1 /100 | #59 | Exceptional 28.1% |
| Immigrants | Turkey | 99.1 /100 | #60 | Exceptional 28.1% |
| Immigrants | North Macedonia | 99.1 /100 | #61 | Exceptional 28.1% |
| Egyptians | 99.0 /100 | #62 | Exceptional 28.2% |
| Immigrants | Serbia | 98.9 /100 | #63 | Exceptional 28.3% |
| Tongans | 98.8 /100 | #64 | Exceptional 28.4% |
| Immigrants | Czechoslovakia | 98.8 /100 | #65 | Exceptional 28.4% |
| Immigrants | Egypt | 98.8 /100 | #66 | Exceptional 28.4% |
| Palestinians | 98.7 /100 | #67 | Exceptional 28.4% |
| Immigrants | Europe | 98.7 /100 | #68 | Exceptional 28.4% |