Chinese vs Immigrants from Kazakhstan Divorced or Separated
COMPARE
Chinese
Immigrants from Kazakhstan
Divorced or Separated
Divorced or Separated Comparison
Chinese
Immigrants from Kazakhstan
11.2%
DIVORCED OR SEPARATED
100.0/ 100
METRIC RATING
42nd/ 347
METRIC RANK
11.7%
DIVORCED OR SEPARATED
97.8/ 100
METRIC RATING
106th/ 347
METRIC RANK
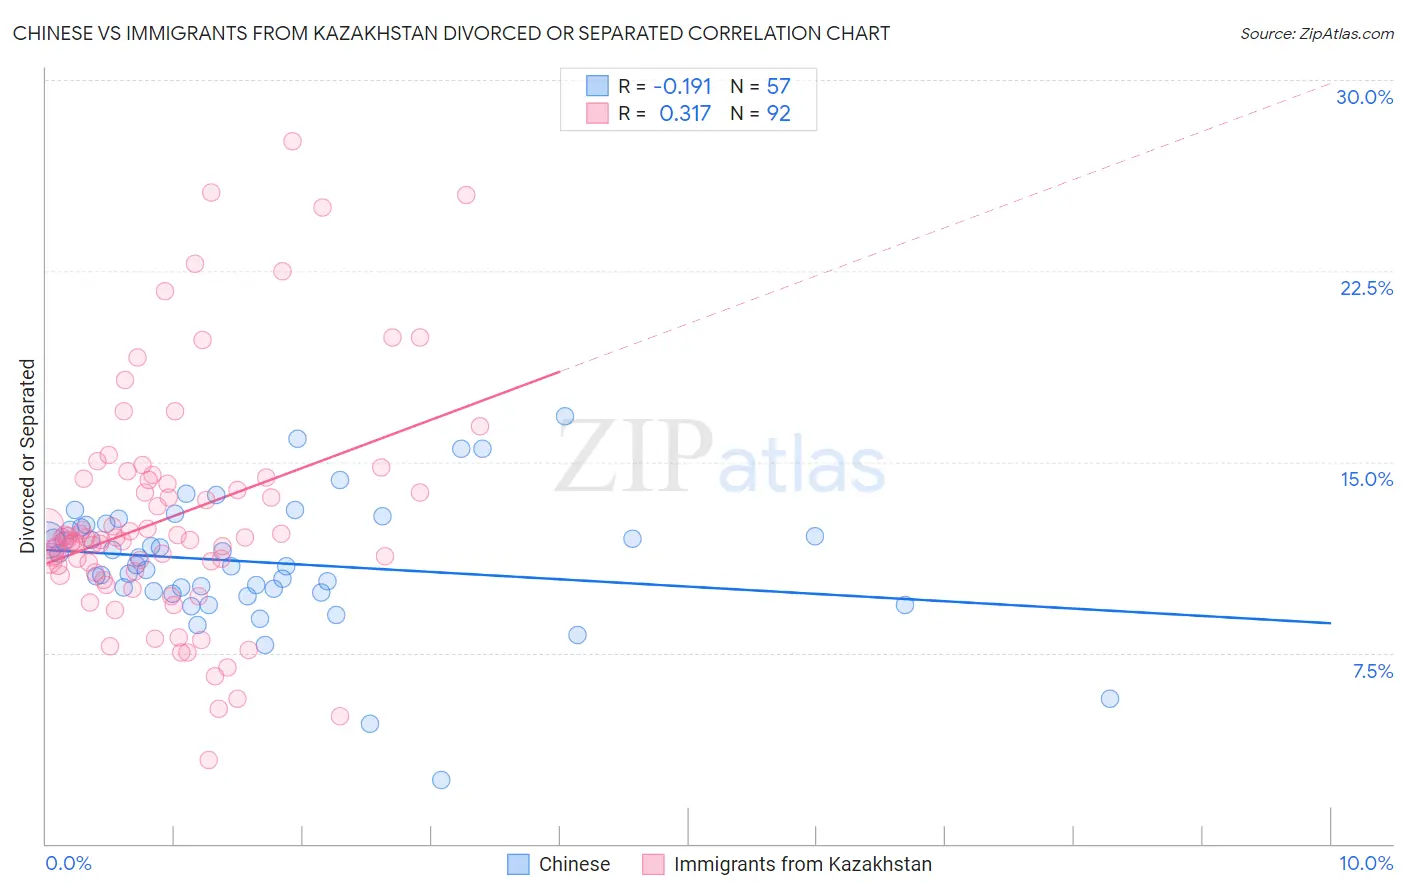
Chinese vs Immigrants from Kazakhstan Divorced or Separated Correlation Chart
The statistical analysis conducted on geographies consisting of 64,808,439 people shows a poor negative correlation between the proportion of Chinese and percentage of population currently divorced or separated in the United States with a correlation coefficient (R) of -0.191 and weighted average of 11.2%. Similarly, the statistical analysis conducted on geographies consisting of 124,441,918 people shows a mild positive correlation between the proportion of Immigrants from Kazakhstan and percentage of population currently divorced or separated in the United States with a correlation coefficient (R) of 0.317 and weighted average of 11.7%, a difference of 4.3%.
Divorced or Separated Correlation Summary
| Measurement | Chinese | Immigrants from Kazakhstan |
| Minimum | 2.5% | 3.3% |
| Maximum | 16.8% | 27.6% |
| Range | 14.3% | 24.3% |
| Mean | 11.1% | 12.8% |
| Median | 11.0% | 12.0% |
| Interquartile 25% (IQ1) | 9.9% | 10.7% |
| Interquartile 75% (IQ3) | 12.5% | 14.3% |
| Interquartile Range (IQR) | 2.6% | 3.6% |
| Standard Deviation (Sample) | 2.5% | 4.6% |
| Standard Deviation (Population) | 2.5% | 4.6% |
Similar Demographics by Divorced or Separated
Demographics Similar to Chinese by Divorced or Separated
In terms of divorced or separated, the demographic groups most similar to Chinese are Immigrants from Belarus (11.2%, a difference of 0.010%), Immigrants from Western Asia (11.2%, a difference of 0.020%), Bhutanese (11.2%, a difference of 0.060%), Turkish (11.2%, a difference of 0.070%), and Laotian (11.2%, a difference of 0.18%).
| Demographics | Rating | Rank | Divorced or Separated |
| Cambodians | 100.0 /100 | #35 | Exceptional 11.1% |
| Immigrants | Japan | 100.0 /100 | #36 | Exceptional 11.1% |
| Immigrants | Lebanon | 100.0 /100 | #37 | Exceptional 11.1% |
| Immigrants | Greece | 100.0 /100 | #38 | Exceptional 11.1% |
| Immigrants | Egypt | 100.0 /100 | #39 | Exceptional 11.1% |
| Soviet Union | 100.0 /100 | #40 | Exceptional 11.1% |
| Bhutanese | 100.0 /100 | #41 | Exceptional 11.2% |
| Chinese | 100.0 /100 | #42 | Exceptional 11.2% |
| Immigrants | Belarus | 100.0 /100 | #43 | Exceptional 11.2% |
| Immigrants | Western Asia | 100.0 /100 | #44 | Exceptional 11.2% |
| Turks | 100.0 /100 | #45 | Exceptional 11.2% |
| Laotians | 100.0 /100 | #46 | Exceptional 11.2% |
| Immigrants | Poland | 100.0 /100 | #47 | Exceptional 11.2% |
| Immigrants | Turkey | 100.0 /100 | #48 | Exceptional 11.2% |
| Immigrants | Saudi Arabia | 100.0 /100 | #49 | Exceptional 11.2% |
Demographics Similar to Immigrants from Kazakhstan by Divorced or Separated
In terms of divorced or separated, the demographic groups most similar to Immigrants from Kazakhstan are Immigrants from El Salvador (11.7%, a difference of 0.040%), Salvadoran (11.6%, a difference of 0.16%), Maltese (11.6%, a difference of 0.18%), Native Hawaiian (11.7%, a difference of 0.21%), and Immigrants from Croatia (11.6%, a difference of 0.22%).
| Demographics | Rating | Rank | Divorced or Separated |
| Immigrants | Sweden | 98.6 /100 | #99 | Exceptional 11.6% |
| Immigrants | Northern Europe | 98.6 /100 | #100 | Exceptional 11.6% |
| Immigrants | Guyana | 98.5 /100 | #101 | Exceptional 11.6% |
| Immigrants | Croatia | 98.3 /100 | #102 | Exceptional 11.6% |
| Maltese | 98.2 /100 | #103 | Exceptional 11.6% |
| Salvadorans | 98.2 /100 | #104 | Exceptional 11.6% |
| Immigrants | El Salvador | 97.9 /100 | #105 | Exceptional 11.7% |
| Immigrants | Kazakhstan | 97.8 /100 | #106 | Exceptional 11.7% |
| Native Hawaiians | 97.2 /100 | #107 | Exceptional 11.7% |
| Greeks | 96.9 /100 | #108 | Exceptional 11.7% |
| Immigrants | South Africa | 96.9 /100 | #109 | Exceptional 11.7% |
| Immigrants | Czechoslovakia | 96.9 /100 | #110 | Exceptional 11.7% |
| Immigrants | Spain | 96.8 /100 | #111 | Exceptional 11.7% |
| Immigrants | France | 96.6 /100 | #112 | Exceptional 11.7% |
| Estonians | 96.6 /100 | #113 | Exceptional 11.7% |