Spanish vs Estonian Single Mother Households
COMPARE
Spanish
Estonian
Single Mother Households
Single Mother Households Comparison
Spanish
Estonians
6.4%
SINGLE MOTHER HOUSEHOLDS
33.4/ 100
METRIC RATING
181st/ 347
METRIC RANK
5.4%
SINGLE MOTHER HOUSEHOLDS
99.6/ 100
METRIC RATING
40th/ 347
METRIC RANK
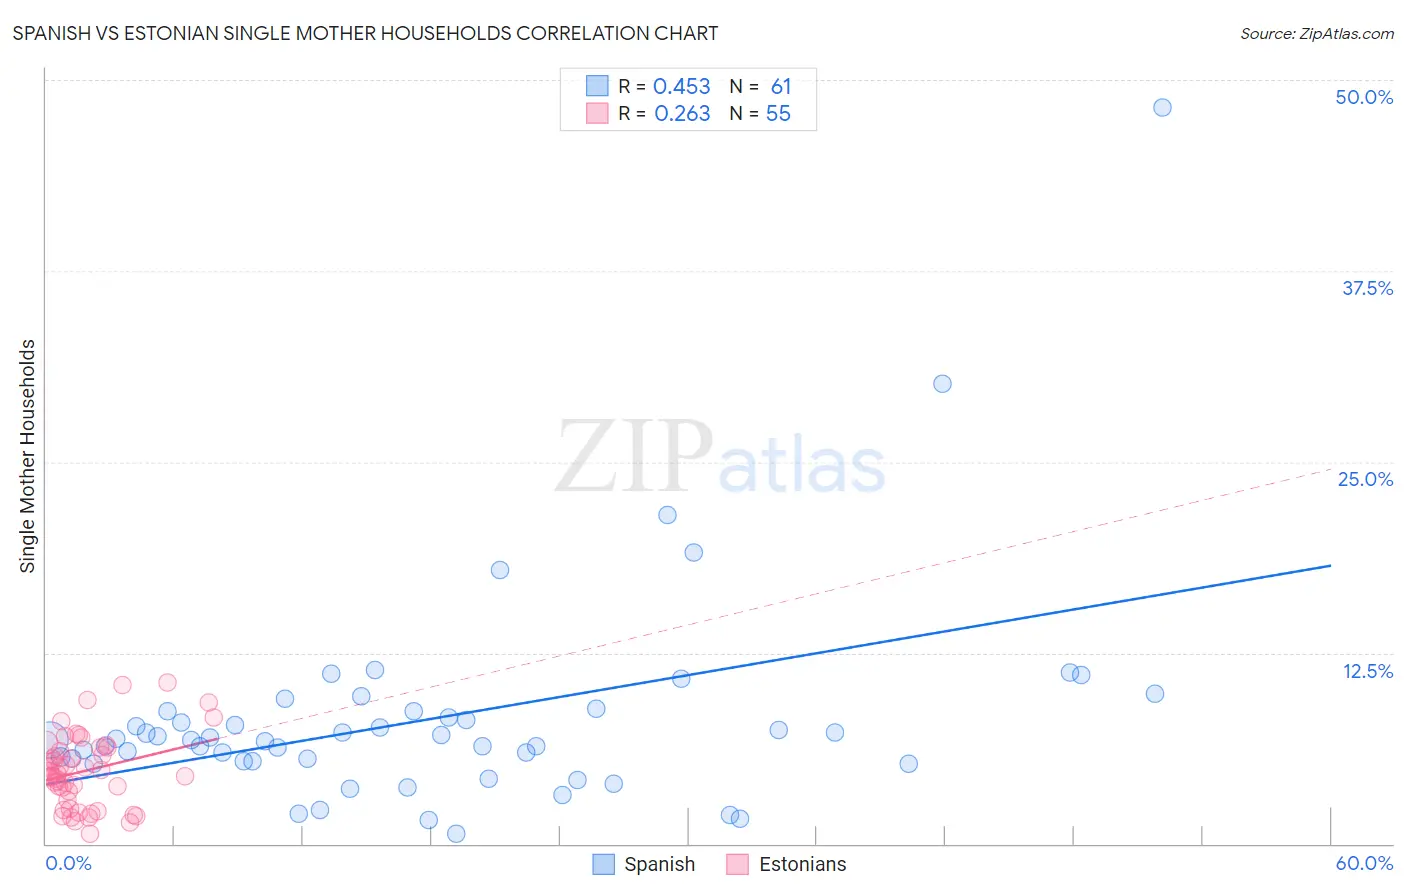
Spanish vs Estonian Single Mother Households Correlation Chart
The statistical analysis conducted on geographies consisting of 420,668,605 people shows a moderate positive correlation between the proportion of Spanish and percentage of single mother households in the United States with a correlation coefficient (R) of 0.453 and weighted average of 6.4%. Similarly, the statistical analysis conducted on geographies consisting of 123,346,647 people shows a weak positive correlation between the proportion of Estonians and percentage of single mother households in the United States with a correlation coefficient (R) of 0.263 and weighted average of 5.4%, a difference of 19.8%.
Single Mother Households Correlation Summary
| Measurement | Spanish | Estonian |
| Minimum | 0.65% | 0.68% |
| Maximum | 48.2% | 10.6% |
| Range | 47.5% | 9.9% |
| Mean | 8.2% | 4.8% |
| Median | 6.8% | 4.6% |
| Interquartile 25% (IQ1) | 5.4% | 2.9% |
| Interquartile 75% (IQ3) | 8.7% | 6.3% |
| Interquartile Range (IQR) | 3.3% | 3.4% |
| Standard Deviation (Sample) | 7.1% | 2.4% |
| Standard Deviation (Population) | 7.0% | 2.3% |
Similar Demographics by Single Mother Households
Demographics Similar to Spanish by Single Mother Households
In terms of single mother households, the demographic groups most similar to Spanish are South American Indian (6.4%, a difference of 0.0%), Immigrants from Nepal (6.4%, a difference of 0.32%), Spaniard (6.5%, a difference of 0.71%), Hmong (6.4%, a difference of 0.74%), and Portuguese (6.4%, a difference of 0.77%).
| Demographics | Rating | Rank | Single Mother Households |
| Immigrants | Morocco | 50.0 /100 | #174 | Average 6.3% |
| Marshallese | 45.8 /100 | #175 | Average 6.3% |
| Immigrants | Bosnia and Herzegovina | 44.3 /100 | #176 | Average 6.3% |
| Osage | 43.0 /100 | #177 | Average 6.4% |
| Portuguese | 40.0 /100 | #178 | Fair 6.4% |
| Hmong | 39.8 /100 | #179 | Fair 6.4% |
| Immigrants | Nepal | 36.1 /100 | #180 | Fair 6.4% |
| Spanish | 33.4 /100 | #181 | Fair 6.4% |
| South American Indians | 33.4 /100 | #182 | Fair 6.4% |
| Spaniards | 27.8 /100 | #183 | Fair 6.5% |
| Ethiopians | 26.0 /100 | #184 | Fair 6.5% |
| Ugandans | 25.6 /100 | #185 | Fair 6.5% |
| Costa Ricans | 24.8 /100 | #186 | Fair 6.5% |
| Immigrants | Afghanistan | 24.7 /100 | #187 | Fair 6.5% |
| Ottawa | 23.8 /100 | #188 | Fair 6.5% |
Demographics Similar to Estonians by Single Mother Households
In terms of single mother households, the demographic groups most similar to Estonians are Immigrants from Sweden (5.4%, a difference of 0.11%), Immigrants from Serbia (5.4%, a difference of 0.25%), Immigrants from Greece (5.4%, a difference of 0.42%), Macedonian (5.4%, a difference of 0.50%), and Immigrants from South Central Asia (5.4%, a difference of 0.56%).
| Demographics | Rating | Rank | Single Mother Households |
| Immigrants | Switzerland | 99.7 /100 | #33 | Exceptional 5.3% |
| Bulgarians | 99.7 /100 | #34 | Exceptional 5.3% |
| Immigrants | Northern Europe | 99.7 /100 | #35 | Exceptional 5.3% |
| Immigrants | Czechoslovakia | 99.7 /100 | #36 | Exceptional 5.3% |
| Immigrants | Belgium | 99.7 /100 | #37 | Exceptional 5.3% |
| Immigrants | Serbia | 99.6 /100 | #38 | Exceptional 5.4% |
| Immigrants | Sweden | 99.6 /100 | #39 | Exceptional 5.4% |
| Estonians | 99.6 /100 | #40 | Exceptional 5.4% |
| Immigrants | Greece | 99.5 /100 | #41 | Exceptional 5.4% |
| Macedonians | 99.5 /100 | #42 | Exceptional 5.4% |
| Immigrants | South Central Asia | 99.5 /100 | #43 | Exceptional 5.4% |
| Lithuanians | 99.4 /100 | #44 | Exceptional 5.4% |
| Immigrants | Croatia | 99.4 /100 | #45 | Exceptional 5.4% |
| Croatians | 99.3 /100 | #46 | Exceptional 5.5% |
| Norwegians | 99.3 /100 | #47 | Exceptional 5.5% |