Asian vs Estonian Single Mother Households
COMPARE
Asian
Estonian
Single Mother Households
Single Mother Households Comparison
Asians
Estonians
5.6%
SINGLE MOTHER HOUSEHOLDS
98.5/ 100
METRIC RATING
69th/ 347
METRIC RANK
5.4%
SINGLE MOTHER HOUSEHOLDS
99.6/ 100
METRIC RATING
40th/ 347
METRIC RANK
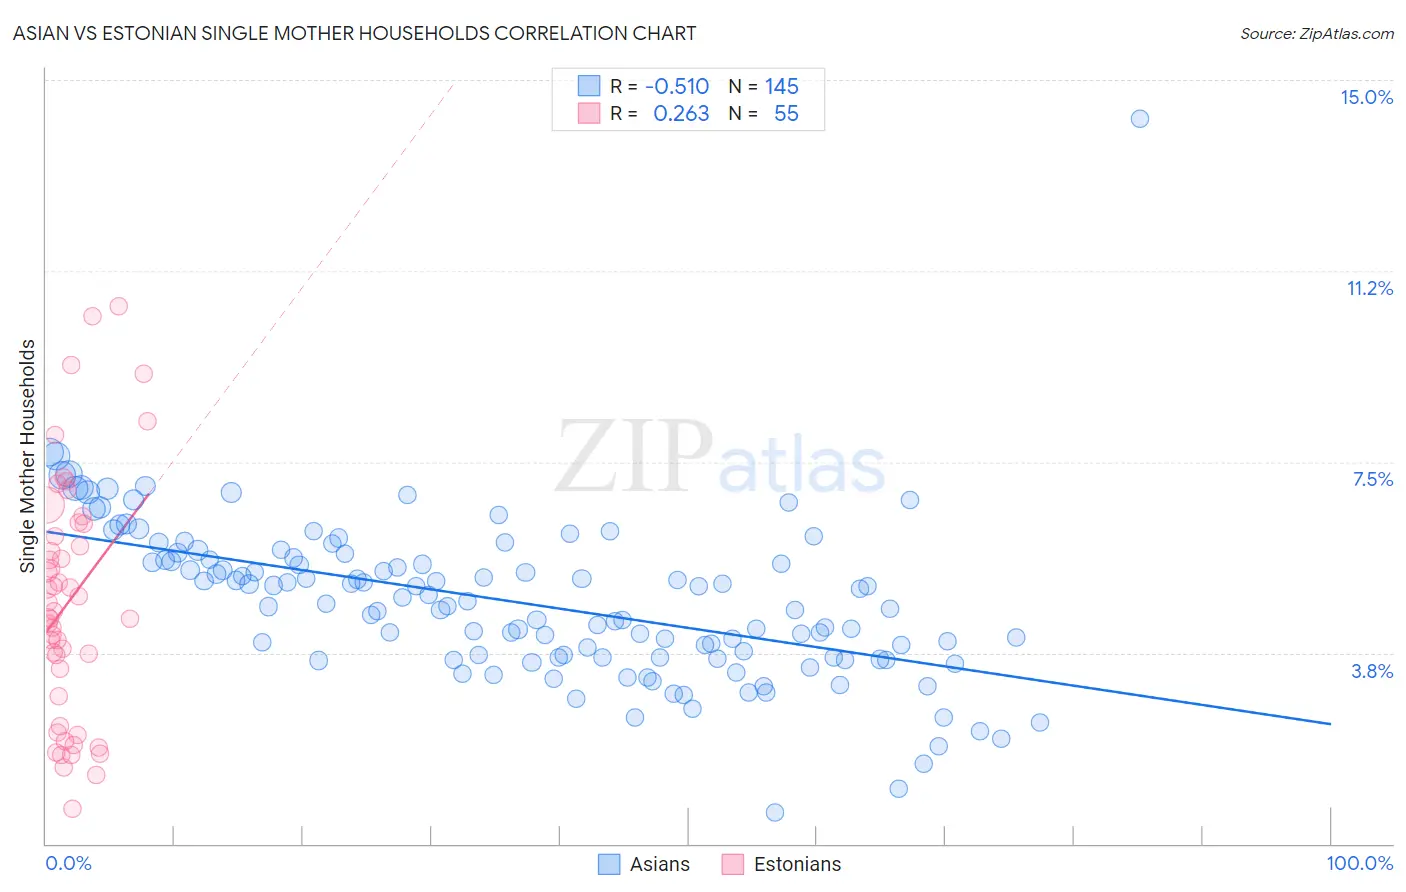
Asian vs Estonian Single Mother Households Correlation Chart
The statistical analysis conducted on geographies consisting of 547,100,295 people shows a substantial negative correlation between the proportion of Asians and percentage of single mother households in the United States with a correlation coefficient (R) of -0.510 and weighted average of 5.6%. Similarly, the statistical analysis conducted on geographies consisting of 123,346,647 people shows a weak positive correlation between the proportion of Estonians and percentage of single mother households in the United States with a correlation coefficient (R) of 0.263 and weighted average of 5.4%, a difference of 4.2%.
Single Mother Households Correlation Summary
| Measurement | Asian | Estonian |
| Minimum | 0.61% | 0.68% |
| Maximum | 14.2% | 10.6% |
| Range | 13.6% | 9.9% |
| Mean | 4.7% | 4.8% |
| Median | 4.7% | 4.6% |
| Interquartile 25% (IQ1) | 3.7% | 2.9% |
| Interquartile 75% (IQ3) | 5.6% | 6.3% |
| Interquartile Range (IQR) | 1.9% | 3.4% |
| Standard Deviation (Sample) | 1.6% | 2.4% |
| Standard Deviation (Population) | 1.6% | 2.3% |
Similar Demographics by Single Mother Households
Demographics Similar to Asians by Single Mother Households
In terms of single mother households, the demographic groups most similar to Asians are Immigrants from Bulgaria (5.6%, a difference of 0.020%), Immigrants from Eastern Europe (5.6%, a difference of 0.080%), Immigrants from Kazakhstan (5.6%, a difference of 0.080%), Italian (5.6%, a difference of 0.090%), and Immigrants from Canada (5.6%, a difference of 0.11%).
| Demographics | Rating | Rank | Single Mother Households |
| Poles | 98.6 /100 | #62 | Exceptional 5.6% |
| Immigrants | North Macedonia | 98.6 /100 | #63 | Exceptional 5.6% |
| Immigrants | France | 98.6 /100 | #64 | Exceptional 5.6% |
| Greeks | 98.6 /100 | #65 | Exceptional 5.6% |
| Immigrants | Canada | 98.5 /100 | #66 | Exceptional 5.6% |
| Italians | 98.5 /100 | #67 | Exceptional 5.6% |
| Immigrants | Bulgaria | 98.5 /100 | #68 | Exceptional 5.6% |
| Asians | 98.5 /100 | #69 | Exceptional 5.6% |
| Immigrants | Eastern Europe | 98.4 /100 | #70 | Exceptional 5.6% |
| Immigrants | Kazakhstan | 98.4 /100 | #71 | Exceptional 5.6% |
| Immigrants | Netherlands | 98.4 /100 | #72 | Exceptional 5.6% |
| Immigrants | Asia | 98.4 /100 | #73 | Exceptional 5.6% |
| Immigrants | North America | 98.3 /100 | #74 | Exceptional 5.6% |
| Slovenes | 98.3 /100 | #75 | Exceptional 5.6% |
| New Zealanders | 98.2 /100 | #76 | Exceptional 5.6% |
Demographics Similar to Estonians by Single Mother Households
In terms of single mother households, the demographic groups most similar to Estonians are Immigrants from Sweden (5.4%, a difference of 0.11%), Immigrants from Serbia (5.4%, a difference of 0.25%), Immigrants from Greece (5.4%, a difference of 0.42%), Macedonian (5.4%, a difference of 0.50%), and Immigrants from South Central Asia (5.4%, a difference of 0.56%).
| Demographics | Rating | Rank | Single Mother Households |
| Immigrants | Switzerland | 99.7 /100 | #33 | Exceptional 5.3% |
| Bulgarians | 99.7 /100 | #34 | Exceptional 5.3% |
| Immigrants | Northern Europe | 99.7 /100 | #35 | Exceptional 5.3% |
| Immigrants | Czechoslovakia | 99.7 /100 | #36 | Exceptional 5.3% |
| Immigrants | Belgium | 99.7 /100 | #37 | Exceptional 5.3% |
| Immigrants | Serbia | 99.6 /100 | #38 | Exceptional 5.4% |
| Immigrants | Sweden | 99.6 /100 | #39 | Exceptional 5.4% |
| Estonians | 99.6 /100 | #40 | Exceptional 5.4% |
| Immigrants | Greece | 99.5 /100 | #41 | Exceptional 5.4% |
| Macedonians | 99.5 /100 | #42 | Exceptional 5.4% |
| Immigrants | South Central Asia | 99.5 /100 | #43 | Exceptional 5.4% |
| Lithuanians | 99.4 /100 | #44 | Exceptional 5.4% |
| Immigrants | Croatia | 99.4 /100 | #45 | Exceptional 5.4% |
| Croatians | 99.3 /100 | #46 | Exceptional 5.5% |
| Norwegians | 99.3 /100 | #47 | Exceptional 5.5% |