Creek vs Nicaraguan Currently Married
COMPARE
Creek
Nicaraguan
Currently Married
Currently Married Comparison
Creek
Nicaraguans
46.0%
CURRENTLY MARRIED
17.2/ 100
METRIC RATING
200th/ 347
METRIC RANK
44.2%
CURRENTLY MARRIED
0.3/ 100
METRIC RATING
248th/ 347
METRIC RANK
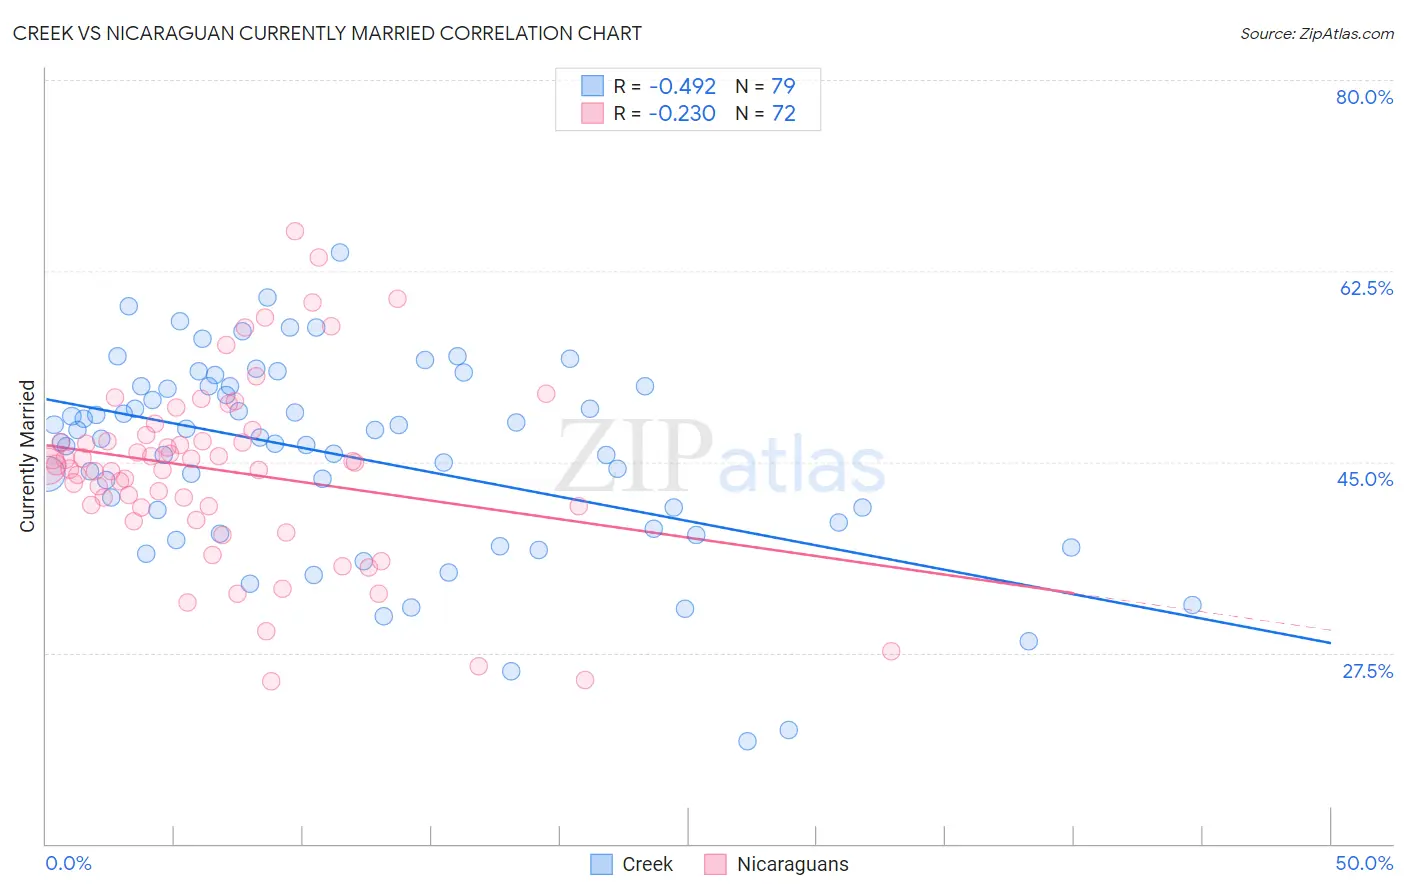
Creek vs Nicaraguan Currently Married Correlation Chart
The statistical analysis conducted on geographies consisting of 178,480,718 people shows a moderate negative correlation between the proportion of Creek and percentage of population currently married in the United States with a correlation coefficient (R) of -0.492 and weighted average of 46.0%. Similarly, the statistical analysis conducted on geographies consisting of 285,678,728 people shows a weak negative correlation between the proportion of Nicaraguans and percentage of population currently married in the United States with a correlation coefficient (R) of -0.230 and weighted average of 44.2%, a difference of 4.0%.
Currently Married Correlation Summary
| Measurement | Creek | Nicaraguan |
| Minimum | 19.4% | 24.9% |
| Maximum | 64.2% | 66.1% |
| Range | 44.8% | 41.2% |
| Mean | 45.4% | 44.2% |
| Median | 47.1% | 44.6% |
| Interquartile 25% (IQ1) | 38.8% | 40.9% |
| Interquartile 75% (IQ3) | 51.9% | 47.2% |
| Interquartile Range (IQR) | 13.1% | 6.3% |
| Standard Deviation (Sample) | 9.0% | 8.4% |
| Standard Deviation (Population) | 9.0% | 8.3% |
Similar Demographics by Currently Married
Demographics Similar to Creek by Currently Married
In terms of currently married, the demographic groups most similar to Creek are Malaysian (45.9%, a difference of 0.13%), Immigrants from Costa Rica (46.0%, a difference of 0.14%), Immigrants from Albania (45.9%, a difference of 0.19%), Immigrants from Colombia (46.1%, a difference of 0.22%), and Immigrants from Kuwait (46.1%, a difference of 0.26%).
| Demographics | Rating | Rank | Currently Married |
| Immigrants | Fiji | 25.0 /100 | #193 | Fair 46.2% |
| South Americans | 23.8 /100 | #194 | Fair 46.1% |
| Immigrants | Nepal | 23.7 /100 | #195 | Fair 46.1% |
| Immigrants | Bosnia and Herzegovina | 22.2 /100 | #196 | Fair 46.1% |
| Immigrants | Kuwait | 21.7 /100 | #197 | Fair 46.1% |
| Immigrants | Colombia | 21.0 /100 | #198 | Fair 46.1% |
| Immigrants | Costa Rica | 19.6 /100 | #199 | Poor 46.0% |
| Creek | 17.2 /100 | #200 | Poor 46.0% |
| Malaysians | 15.3 /100 | #201 | Poor 45.9% |
| Immigrants | Albania | 14.5 /100 | #202 | Poor 45.9% |
| Taiwanese | 11.7 /100 | #203 | Poor 45.8% |
| Immigrants | Spain | 11.6 /100 | #204 | Poor 45.8% |
| South American Indians | 11.5 /100 | #205 | Poor 45.8% |
| Immigrants | Immigrants | 11.2 /100 | #206 | Poor 45.8% |
| Immigrants | South America | 10.8 /100 | #207 | Poor 45.7% |
Demographics Similar to Nicaraguans by Currently Married
In terms of currently married, the demographic groups most similar to Nicaraguans are Immigrants from Cameroon (44.2%, a difference of 0.020%), Immigrants from Eastern Africa (44.2%, a difference of 0.040%), Ugandan (44.2%, a difference of 0.090%), Blackfeet (44.2%, a difference of 0.10%), and Hispanic or Latino (44.1%, a difference of 0.12%).
| Demographics | Rating | Rank | Currently Married |
| Ethiopians | 0.7 /100 | #241 | Tragic 44.5% |
| Immigrants | Cambodia | 0.7 /100 | #242 | Tragic 44.5% |
| Immigrants | Ethiopia | 0.7 /100 | #243 | Tragic 44.5% |
| Japanese | 0.6 /100 | #244 | Tragic 44.5% |
| Immigrants | Armenia | 0.4 /100 | #245 | Tragic 44.3% |
| Immigrants | Burma/Myanmar | 0.4 /100 | #246 | Tragic 44.3% |
| Ugandans | 0.4 /100 | #247 | Tragic 44.2% |
| Nicaraguans | 0.3 /100 | #248 | Tragic 44.2% |
| Immigrants | Cameroon | 0.3 /100 | #249 | Tragic 44.2% |
| Immigrants | Eastern Africa | 0.3 /100 | #250 | Tragic 44.2% |
| Blackfeet | 0.3 /100 | #251 | Tragic 44.2% |
| Hispanics or Latinos | 0.3 /100 | #252 | Tragic 44.1% |
| Immigrants | Central America | 0.3 /100 | #253 | Tragic 44.1% |
| Vietnamese | 0.2 /100 | #254 | Tragic 44.0% |
| Yakama | 0.2 /100 | #255 | Tragic 44.0% |