Immigrants from Pakistan vs Immigrants from Venezuela Married-couple Households
COMPARE
Immigrants from Pakistan
Immigrants from Venezuela
Married-couple Households
Married-couple Households Comparison
Immigrants from Pakistan
Immigrants from Venezuela
50.1%
MARRIED-COUPLE HOUSEHOLDS
100.0/ 100
METRIC RATING
11th/ 347
METRIC RANK
47.4%
MARRIED-COUPLE HOUSEHOLDS
89.3/ 100
METRIC RATING
123rd/ 347
METRIC RANK
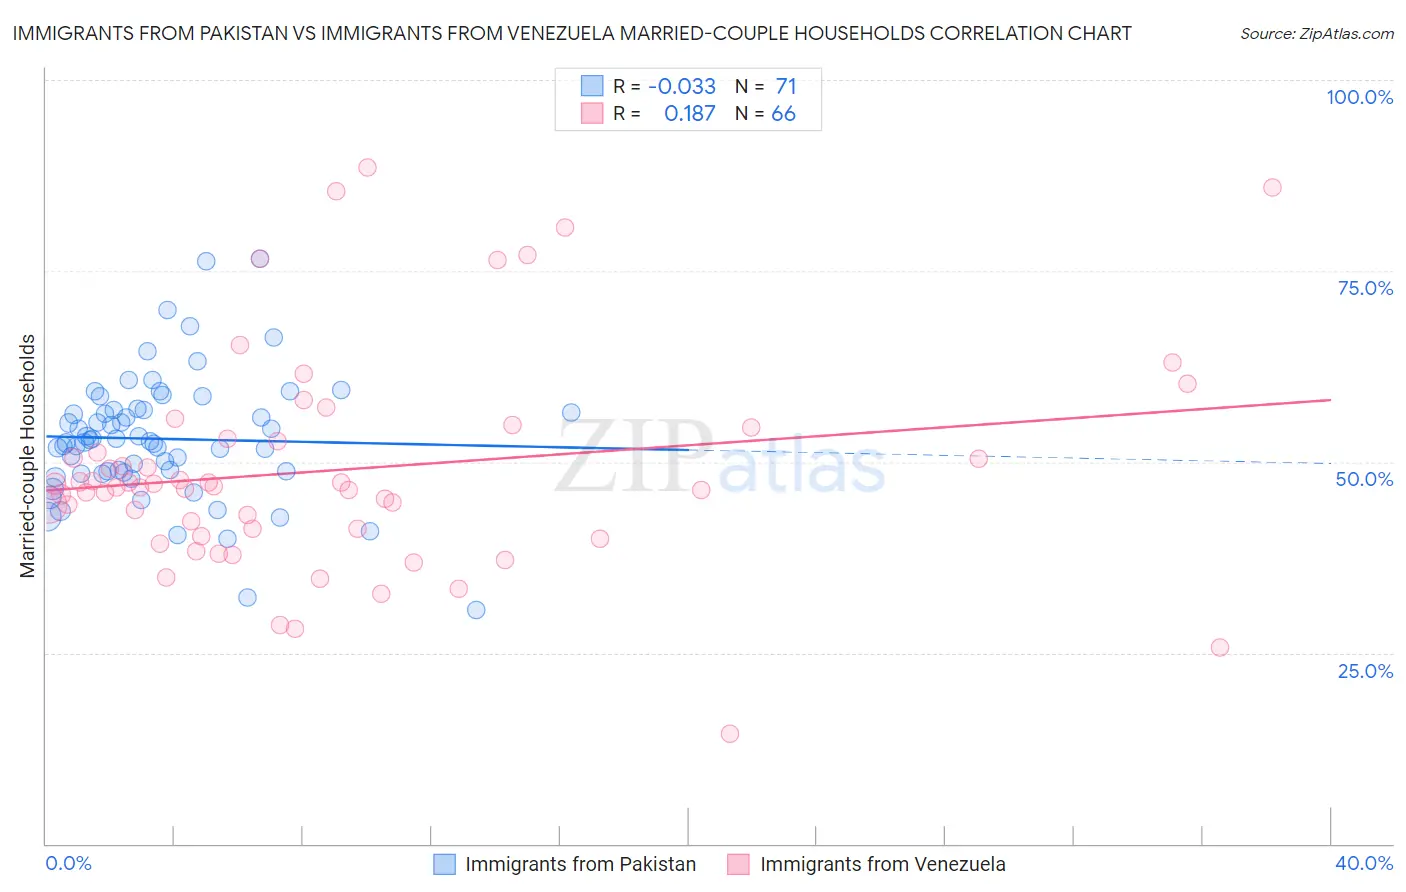
Immigrants from Pakistan vs Immigrants from Venezuela Married-couple Households Correlation Chart
The statistical analysis conducted on geographies consisting of 283,790,790 people shows no correlation between the proportion of Immigrants from Pakistan and percentage of married-couple family households in the United States with a correlation coefficient (R) of -0.033 and weighted average of 50.1%. Similarly, the statistical analysis conducted on geographies consisting of 287,780,225 people shows a poor positive correlation between the proportion of Immigrants from Venezuela and percentage of married-couple family households in the United States with a correlation coefficient (R) of 0.187 and weighted average of 47.4%, a difference of 5.8%.
Married-couple Households Correlation Summary
| Measurement | Immigrants from Pakistan | Immigrants from Venezuela |
| Minimum | 30.6% | 14.4% |
| Maximum | 76.6% | 88.5% |
| Range | 46.0% | 74.1% |
| Mean | 53.0% | 49.0% |
| Median | 52.8% | 46.8% |
| Interquartile 25% (IQ1) | 48.7% | 41.2% |
| Interquartile 75% (IQ3) | 56.7% | 53.1% |
| Interquartile Range (IQR) | 8.1% | 11.9% |
| Standard Deviation (Sample) | 8.2% | 14.4% |
| Standard Deviation (Population) | 8.2% | 14.2% |
Similar Demographics by Married-couple Households
Demographics Similar to Immigrants from Pakistan by Married-couple Households
In terms of married-couple households, the demographic groups most similar to Immigrants from Pakistan are Swiss (49.9%, a difference of 0.37%), Pennsylvania German (50.4%, a difference of 0.44%), Chinese (50.4%, a difference of 0.44%), Immigrants from Korea (49.9%, a difference of 0.54%), and Burmese (49.8%, a difference of 0.66%).
| Demographics | Rating | Rank | Married-couple Households |
| Assyrians/Chaldeans/Syriacs | 100.0 /100 | #4 | Exceptional 51.8% |
| Tongans | 100.0 /100 | #5 | Exceptional 51.6% |
| Danes | 100.0 /100 | #6 | Exceptional 51.1% |
| Filipinos | 100.0 /100 | #7 | Exceptional 51.0% |
| Immigrants | South Central Asia | 100.0 /100 | #8 | Exceptional 50.6% |
| Pennsylvania Germans | 100.0 /100 | #9 | Exceptional 50.4% |
| Chinese | 100.0 /100 | #10 | Exceptional 50.4% |
| Immigrants | Pakistan | 100.0 /100 | #11 | Exceptional 50.1% |
| Swiss | 100.0 /100 | #12 | Exceptional 49.9% |
| Immigrants | Korea | 100.0 /100 | #13 | Exceptional 49.9% |
| Burmese | 100.0 /100 | #14 | Exceptional 49.8% |
| Koreans | 99.9 /100 | #15 | Exceptional 49.7% |
| Swedes | 99.9 /100 | #16 | Exceptional 49.7% |
| Immigrants | Hong Kong | 99.9 /100 | #17 | Exceptional 49.6% |
| English | 99.9 /100 | #18 | Exceptional 49.6% |
Demographics Similar to Immigrants from Venezuela by Married-couple Households
In terms of married-couple households, the demographic groups most similar to Immigrants from Venezuela are Zimbabwean (47.4%, a difference of 0.010%), Australian (47.4%, a difference of 0.030%), Pakistani (47.3%, a difference of 0.060%), Okinawan (47.4%, a difference of 0.080%), and Immigrants from Eastern Europe (47.4%, a difference of 0.10%).
| Demographics | Rating | Rank | Married-couple Households |
| Argentineans | 92.5 /100 | #116 | Exceptional 47.5% |
| French Canadians | 92.4 /100 | #117 | Exceptional 47.5% |
| Immigrants | Germany | 92.4 /100 | #118 | Exceptional 47.5% |
| Chileans | 92.2 /100 | #119 | Exceptional 47.5% |
| Puget Sound Salish | 90.5 /100 | #120 | Exceptional 47.4% |
| Immigrants | Eastern Europe | 90.3 /100 | #121 | Exceptional 47.4% |
| Okinawans | 90.1 /100 | #122 | Exceptional 47.4% |
| Immigrants | Venezuela | 89.3 /100 | #123 | Excellent 47.4% |
| Zimbabweans | 89.2 /100 | #124 | Excellent 47.4% |
| Australians | 89.0 /100 | #125 | Excellent 47.4% |
| Pakistanis | 88.6 /100 | #126 | Excellent 47.3% |
| Celtics | 88.1 /100 | #127 | Excellent 47.3% |
| Immigrants | Peru | 87.9 /100 | #128 | Excellent 47.3% |
| Immigrants | Iraq | 87.8 /100 | #129 | Excellent 47.3% |
| Immigrants | Hungary | 87.8 /100 | #130 | Excellent 47.3% |