Native Hawaiian vs Immigrants from Panama Married-couple Households
COMPARE
Native Hawaiian
Immigrants from Panama
Married-couple Households
Married-couple Households Comparison
Native Hawaiians
Immigrants from Panama
49.1%
MARRIED-COUPLE HOUSEHOLDS
99.8/ 100
METRIC RATING
31st/ 347
METRIC RANK
44.6%
MARRIED-COUPLE HOUSEHOLDS
1.3/ 100
METRIC RATING
234th/ 347
METRIC RANK
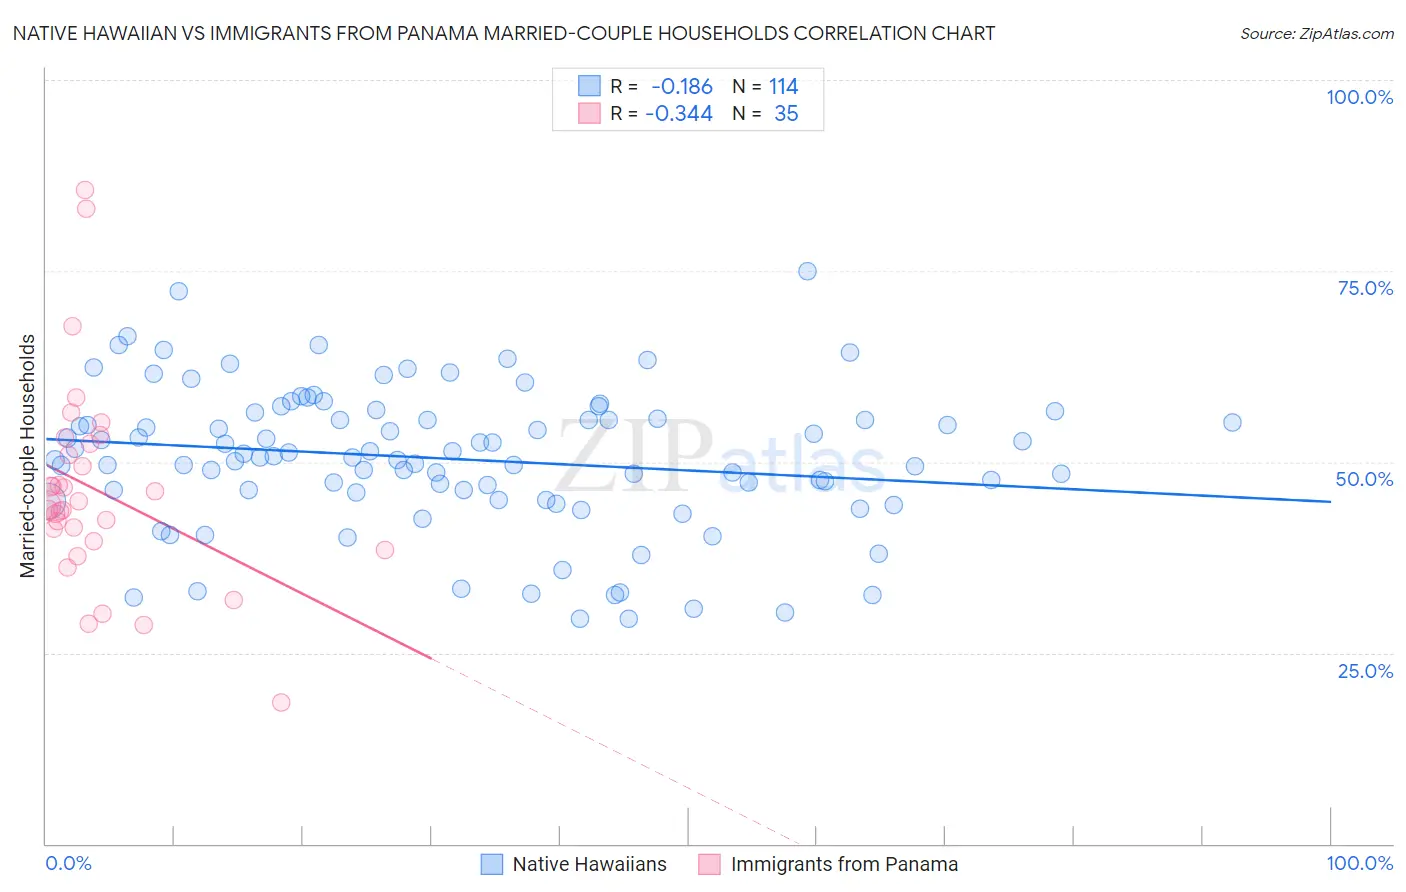
Native Hawaiian vs Immigrants from Panama Married-couple Households Correlation Chart
The statistical analysis conducted on geographies consisting of 331,869,036 people shows a poor negative correlation between the proportion of Native Hawaiians and percentage of married-couple family households in the United States with a correlation coefficient (R) of -0.186 and weighted average of 49.1%. Similarly, the statistical analysis conducted on geographies consisting of 221,156,465 people shows a mild negative correlation between the proportion of Immigrants from Panama and percentage of married-couple family households in the United States with a correlation coefficient (R) of -0.344 and weighted average of 44.6%, a difference of 10.2%.
Married-couple Households Correlation Summary
| Measurement | Native Hawaiian | Immigrants from Panama |
| Minimum | 29.5% | 18.6% |
| Maximum | 75.0% | 85.7% |
| Range | 45.5% | 67.1% |
| Mean | 50.4% | 46.3% |
| Median | 50.7% | 44.4% |
| Interquartile 25% (IQ1) | 46.0% | 39.6% |
| Interquartile 75% (IQ3) | 55.6% | 52.4% |
| Interquartile Range (IQR) | 9.6% | 12.9% |
| Standard Deviation (Sample) | 9.3% | 13.4% |
| Standard Deviation (Population) | 9.3% | 13.2% |
Similar Demographics by Married-couple Households
Demographics Similar to Native Hawaiians by Married-couple Households
In terms of married-couple households, the demographic groups most similar to Native Hawaiians are Hungarian (49.1%, a difference of 0.060%), Immigrants from Asia (49.1%, a difference of 0.090%), Bolivian (49.2%, a difference of 0.11%), Maltese (49.2%, a difference of 0.12%), and German (49.2%, a difference of 0.13%).
| Demographics | Rating | Rank | Married-couple Households |
| Czechs | 99.9 /100 | #24 | Exceptional 49.4% |
| Immigrants | Philippines | 99.9 /100 | #25 | Exceptional 49.3% |
| Immigrants | Scotland | 99.8 /100 | #26 | Exceptional 49.3% |
| Bhutanese | 99.8 /100 | #27 | Exceptional 49.3% |
| Germans | 99.8 /100 | #28 | Exceptional 49.2% |
| Maltese | 99.8 /100 | #29 | Exceptional 49.2% |
| Bolivians | 99.8 /100 | #30 | Exceptional 49.2% |
| Native Hawaiians | 99.8 /100 | #31 | Exceptional 49.1% |
| Hungarians | 99.8 /100 | #32 | Exceptional 49.1% |
| Immigrants | Asia | 99.7 /100 | #33 | Exceptional 49.1% |
| Italians | 99.7 /100 | #34 | Exceptional 49.0% |
| Scottish | 99.7 /100 | #35 | Exceptional 49.0% |
| Iranians | 99.7 /100 | #36 | Exceptional 49.0% |
| Sri Lankans | 99.7 /100 | #37 | Exceptional 49.0% |
| Greeks | 99.7 /100 | #38 | Exceptional 48.9% |
Demographics Similar to Immigrants from Panama by Married-couple Households
In terms of married-couple households, the demographic groups most similar to Immigrants from Panama are Immigrants from Nicaragua (44.5%, a difference of 0.070%), Yaqui (44.5%, a difference of 0.080%), Comanche (44.5%, a difference of 0.11%), Immigrants from Uganda (44.6%, a difference of 0.12%), and Houma (44.6%, a difference of 0.16%).
| Demographics | Rating | Rank | Married-couple Households |
| Salvadorans | 1.9 /100 | #227 | Tragic 44.7% |
| Kenyans | 1.7 /100 | #228 | Tragic 44.7% |
| Immigrants | Latin America | 1.6 /100 | #229 | Tragic 44.7% |
| Soviet Union | 1.6 /100 | #230 | Tragic 44.6% |
| Houma | 1.5 /100 | #231 | Tragic 44.6% |
| Marshallese | 1.5 /100 | #232 | Tragic 44.6% |
| Immigrants | Uganda | 1.5 /100 | #233 | Tragic 44.6% |
| Immigrants | Panama | 1.3 /100 | #234 | Tragic 44.6% |
| Immigrants | Nicaragua | 1.2 /100 | #235 | Tragic 44.5% |
| Yaqui | 1.2 /100 | #236 | Tragic 44.5% |
| Comanche | 1.2 /100 | #237 | Tragic 44.5% |
| Immigrants | Uruguay | 1.1 /100 | #238 | Tragic 44.5% |
| Spanish Americans | 1.1 /100 | #239 | Tragic 44.5% |
| Ute | 1.0 /100 | #240 | Tragic 44.4% |
| Immigrants | Bosnia and Herzegovina | 1.0 /100 | #241 | Tragic 44.4% |