Colville vs Immigrants from Guyana Currently Married
COMPARE
Colville
Immigrants from Guyana
Currently Married
Currently Married Comparison
Colville
Immigrants from Guyana
43.4%
CURRENTLY MARRIED
0.1/ 100
METRIC RATING
275th/ 347
METRIC RANK
41.9%
CURRENTLY MARRIED
0.0/ 100
METRIC RATING
306th/ 347
METRIC RANK
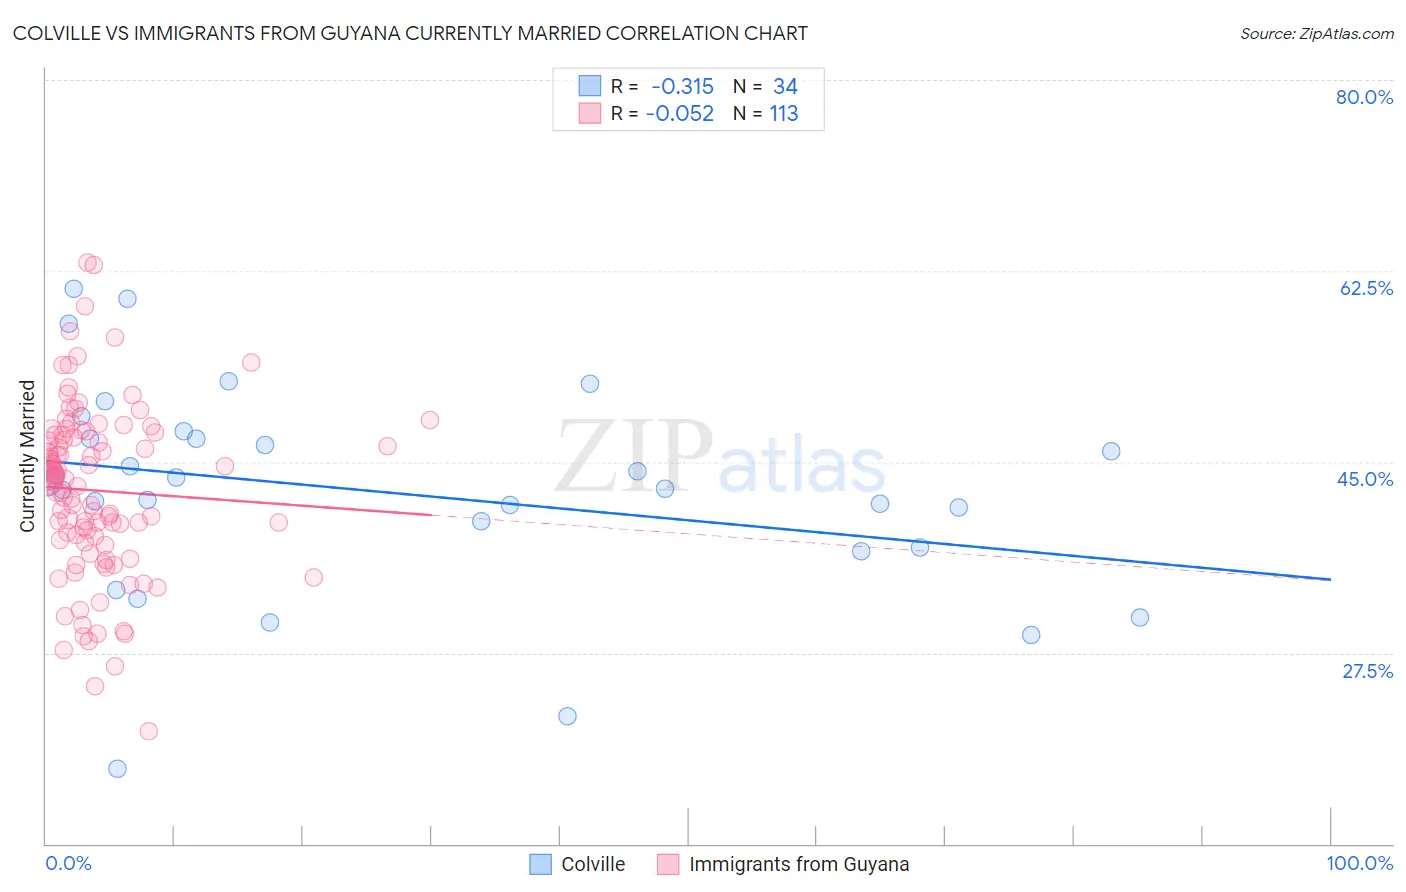
Colville vs Immigrants from Guyana Currently Married Correlation Chart
The statistical analysis conducted on geographies consisting of 34,682,856 people shows a mild negative correlation between the proportion of Colville and percentage of population currently married in the United States with a correlation coefficient (R) of -0.315 and weighted average of 43.4%. Similarly, the statistical analysis conducted on geographies consisting of 183,739,040 people shows a slight negative correlation between the proportion of Immigrants from Guyana and percentage of population currently married in the United States with a correlation coefficient (R) of -0.052 and weighted average of 41.9%, a difference of 3.7%.
Currently Married Correlation Summary
| Measurement | Colville | Immigrants from Guyana |
| Minimum | 16.9% | 20.3% |
| Maximum | 60.9% | 63.3% |
| Range | 44.0% | 43.0% |
| Mean | 42.2% | 42.4% |
| Median | 42.8% | 43.5% |
| Interquartile 25% (IQ1) | 37.2% | 37.7% |
| Interquartile 75% (IQ3) | 47.1% | 47.5% |
| Interquartile Range (IQR) | 9.9% | 9.8% |
| Standard Deviation (Sample) | 9.7% | 7.9% |
| Standard Deviation (Population) | 9.5% | 7.8% |
Similar Demographics by Currently Married
Demographics Similar to Colville by Currently Married
In terms of currently married, the demographic groups most similar to Colville are Nigerian (43.4%, a difference of 0.020%), Sierra Leonean (43.4%, a difference of 0.030%), Yaqui (43.4%, a difference of 0.040%), Immigrants from Nigeria (43.4%, a difference of 0.040%), and Indonesian (43.5%, a difference of 0.080%).
| Demographics | Rating | Rank | Currently Married |
| Spanish American Indians | 0.1 /100 | #268 | Tragic 43.6% |
| Immigrants | Sudan | 0.1 /100 | #269 | Tragic 43.5% |
| Salvadorans | 0.1 /100 | #270 | Tragic 43.5% |
| Bermudans | 0.1 /100 | #271 | Tragic 43.5% |
| Indonesians | 0.1 /100 | #272 | Tragic 43.5% |
| Yaqui | 0.1 /100 | #273 | Tragic 43.4% |
| Nigerians | 0.1 /100 | #274 | Tragic 43.4% |
| Colville | 0.1 /100 | #275 | Tragic 43.4% |
| Sierra Leoneans | 0.1 /100 | #276 | Tragic 43.4% |
| Immigrants | Nigeria | 0.1 /100 | #277 | Tragic 43.4% |
| Central Americans | 0.0 /100 | #278 | Tragic 43.3% |
| Central American Indians | 0.0 /100 | #279 | Tragic 43.3% |
| Apache | 0.0 /100 | #280 | Tragic 43.2% |
| Chippewa | 0.0 /100 | #281 | Tragic 43.2% |
| Immigrants | Ecuador | 0.0 /100 | #282 | Tragic 43.2% |
Demographics Similar to Immigrants from Guyana by Currently Married
In terms of currently married, the demographic groups most similar to Immigrants from Guyana are Immigrants from Trinidad and Tobago (41.9%, a difference of 0.010%), Immigrants from Bahamas (41.9%, a difference of 0.040%), African (41.8%, a difference of 0.13%), Sioux (41.9%, a difference of 0.16%), and Immigrants from Zaire (42.0%, a difference of 0.17%).
| Demographics | Rating | Rank | Currently Married |
| Liberians | 0.0 /100 | #299 | Tragic 42.2% |
| Belizeans | 0.0 /100 | #300 | Tragic 42.2% |
| Immigrants | Yemen | 0.0 /100 | #301 | Tragic 42.1% |
| Immigrants | Zaire | 0.0 /100 | #302 | Tragic 42.0% |
| Sioux | 0.0 /100 | #303 | Tragic 41.9% |
| Immigrants | Bahamas | 0.0 /100 | #304 | Tragic 41.9% |
| Immigrants | Trinidad and Tobago | 0.0 /100 | #305 | Tragic 41.9% |
| Immigrants | Guyana | 0.0 /100 | #306 | Tragic 41.9% |
| Africans | 0.0 /100 | #307 | Tragic 41.8% |
| Immigrants | Belize | 0.0 /100 | #308 | Tragic 41.8% |
| Immigrants | Liberia | 0.0 /100 | #309 | Tragic 41.8% |
| Guyanese | 0.0 /100 | #310 | Tragic 41.6% |
| Trinidadians and Tobagonians | 0.0 /100 | #311 | Tragic 41.5% |
| Somalis | 0.0 /100 | #312 | Tragic 41.5% |
| Jamaicans | 0.0 /100 | #313 | Tragic 41.4% |