Colville vs Immigrants from Africa Currently Married
COMPARE
Colville
Immigrants from Africa
Currently Married
Currently Married Comparison
Colville
Immigrants from Africa
43.4%
CURRENTLY MARRIED
0.1/ 100
METRIC RATING
275th/ 347
METRIC RANK
43.9%
CURRENTLY MARRIED
0.2/ 100
METRIC RATING
257th/ 347
METRIC RANK
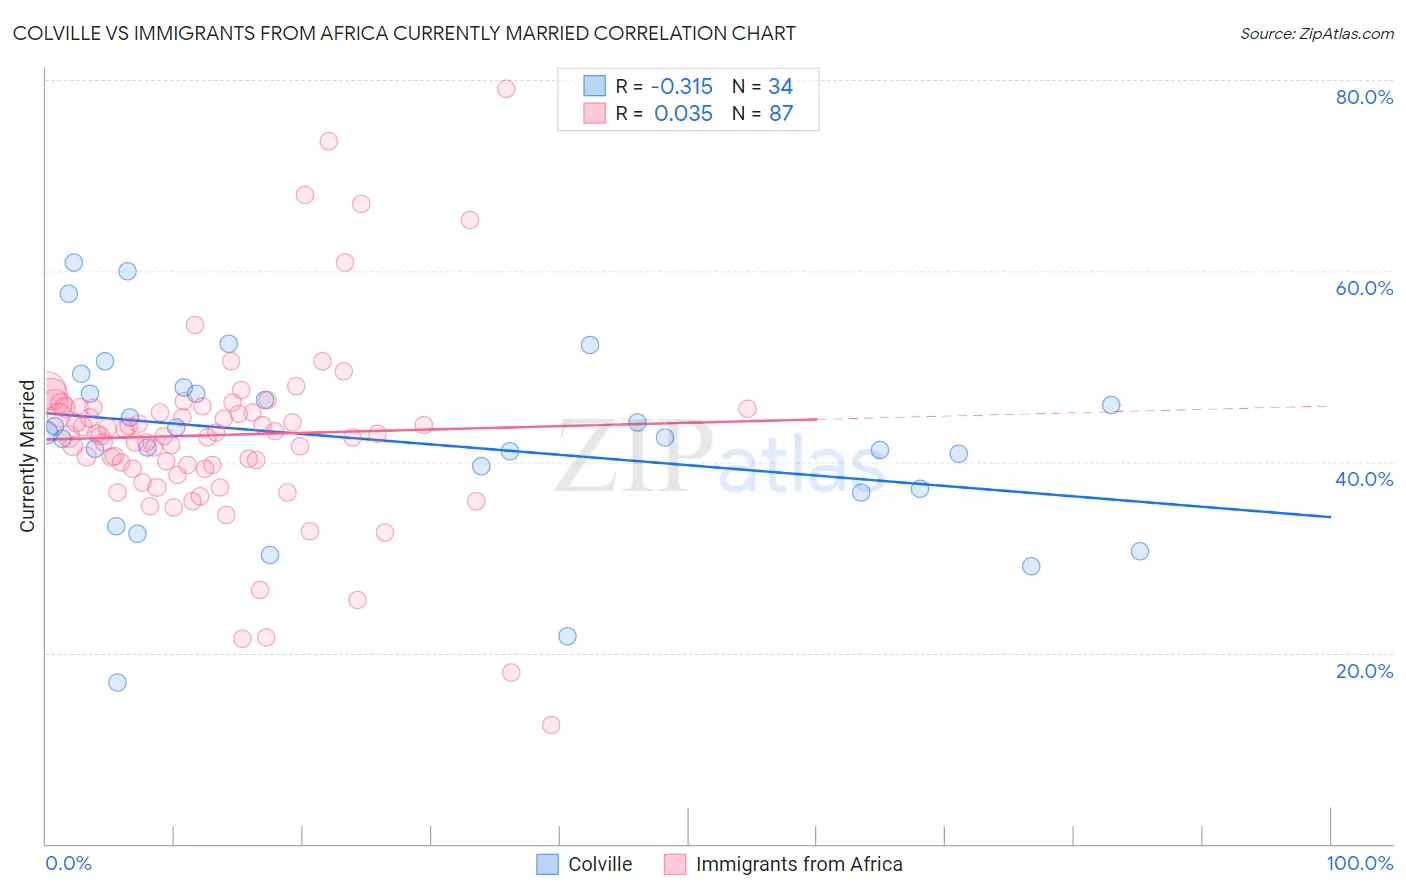
Colville vs Immigrants from Africa Currently Married Correlation Chart
The statistical analysis conducted on geographies consisting of 34,682,856 people shows a mild negative correlation between the proportion of Colville and percentage of population currently married in the United States with a correlation coefficient (R) of -0.315 and weighted average of 43.4%. Similarly, the statistical analysis conducted on geographies consisting of 469,352,442 people shows no correlation between the proportion of Immigrants from Africa and percentage of population currently married in the United States with a correlation coefficient (R) of 0.035 and weighted average of 43.9%, a difference of 1.0%.
Currently Married Correlation Summary
| Measurement | Colville | Immigrants from Africa |
| Minimum | 16.9% | 12.5% |
| Maximum | 60.9% | 79.1% |
| Range | 44.0% | 66.6% |
| Mean | 42.2% | 42.8% |
| Median | 42.8% | 43.0% |
| Interquartile 25% (IQ1) | 37.2% | 39.3% |
| Interquartile 75% (IQ3) | 47.1% | 45.6% |
| Interquartile Range (IQR) | 9.9% | 6.4% |
| Standard Deviation (Sample) | 9.7% | 10.0% |
| Standard Deviation (Population) | 9.5% | 10.0% |
Demographics Similar to Colville and Immigrants from Africa by Currently Married
In terms of currently married, the demographic groups most similar to Colville are Nigerian (43.4%, a difference of 0.020%), Sierra Leonean (43.4%, a difference of 0.030%), Yaqui (43.4%, a difference of 0.040%), Indonesian (43.5%, a difference of 0.080%), and Bermudan (43.5%, a difference of 0.12%). Similarly, the demographic groups most similar to Immigrants from Africa are Ute (43.9%, a difference of 0.010%), Shoshone (44.0%, a difference of 0.20%), Immigrants from Sierra Leone (43.8%, a difference of 0.22%), Immigrants from Latin America (43.8%, a difference of 0.28%), and Immigrants from Nicaragua (43.7%, a difference of 0.32%).
| Demographics | Rating | Rank | Currently Married |
| Shoshone | 0.2 /100 | #256 | Tragic 44.0% |
| Immigrants | Africa | 0.2 /100 | #257 | Tragic 43.9% |
| Ute | 0.2 /100 | #258 | Tragic 43.9% |
| Immigrants | Sierra Leone | 0.1 /100 | #259 | Tragic 43.8% |
| Immigrants | Latin America | 0.1 /100 | #260 | Tragic 43.8% |
| Immigrants | Nicaragua | 0.1 /100 | #261 | Tragic 43.7% |
| Bangladeshis | 0.1 /100 | #262 | Tragic 43.7% |
| Immigrants | Cuba | 0.1 /100 | #263 | Tragic 43.7% |
| Sudanese | 0.1 /100 | #264 | Tragic 43.7% |
| Immigrants | Bangladesh | 0.1 /100 | #265 | Tragic 43.6% |
| Ecuadorians | 0.1 /100 | #266 | Tragic 43.6% |
| Immigrants | Eritrea | 0.1 /100 | #267 | Tragic 43.6% |
| Spanish American Indians | 0.1 /100 | #268 | Tragic 43.6% |
| Immigrants | Sudan | 0.1 /100 | #269 | Tragic 43.5% |
| Salvadorans | 0.1 /100 | #270 | Tragic 43.5% |
| Bermudans | 0.1 /100 | #271 | Tragic 43.5% |
| Indonesians | 0.1 /100 | #272 | Tragic 43.5% |
| Yaqui | 0.1 /100 | #273 | Tragic 43.4% |
| Nigerians | 0.1 /100 | #274 | Tragic 43.4% |
| Colville | 0.1 /100 | #275 | Tragic 43.4% |
| Sierra Leoneans | 0.1 /100 | #276 | Tragic 43.4% |