Colombian vs Immigrants from Portugal Births to Unmarried Women
COMPARE
Colombian
Immigrants from Portugal
Births to Unmarried Women
Births to Unmarried Women Comparison
Colombians
Immigrants from Portugal
32.2%
BIRTHS TO UNMARRIED WOMEN
31.9/ 100
METRIC RATING
192nd/ 347
METRIC RANK
36.2%
BIRTHS TO UNMARRIED WOMEN
0.2/ 100
METRIC RATING
253rd/ 347
METRIC RANK
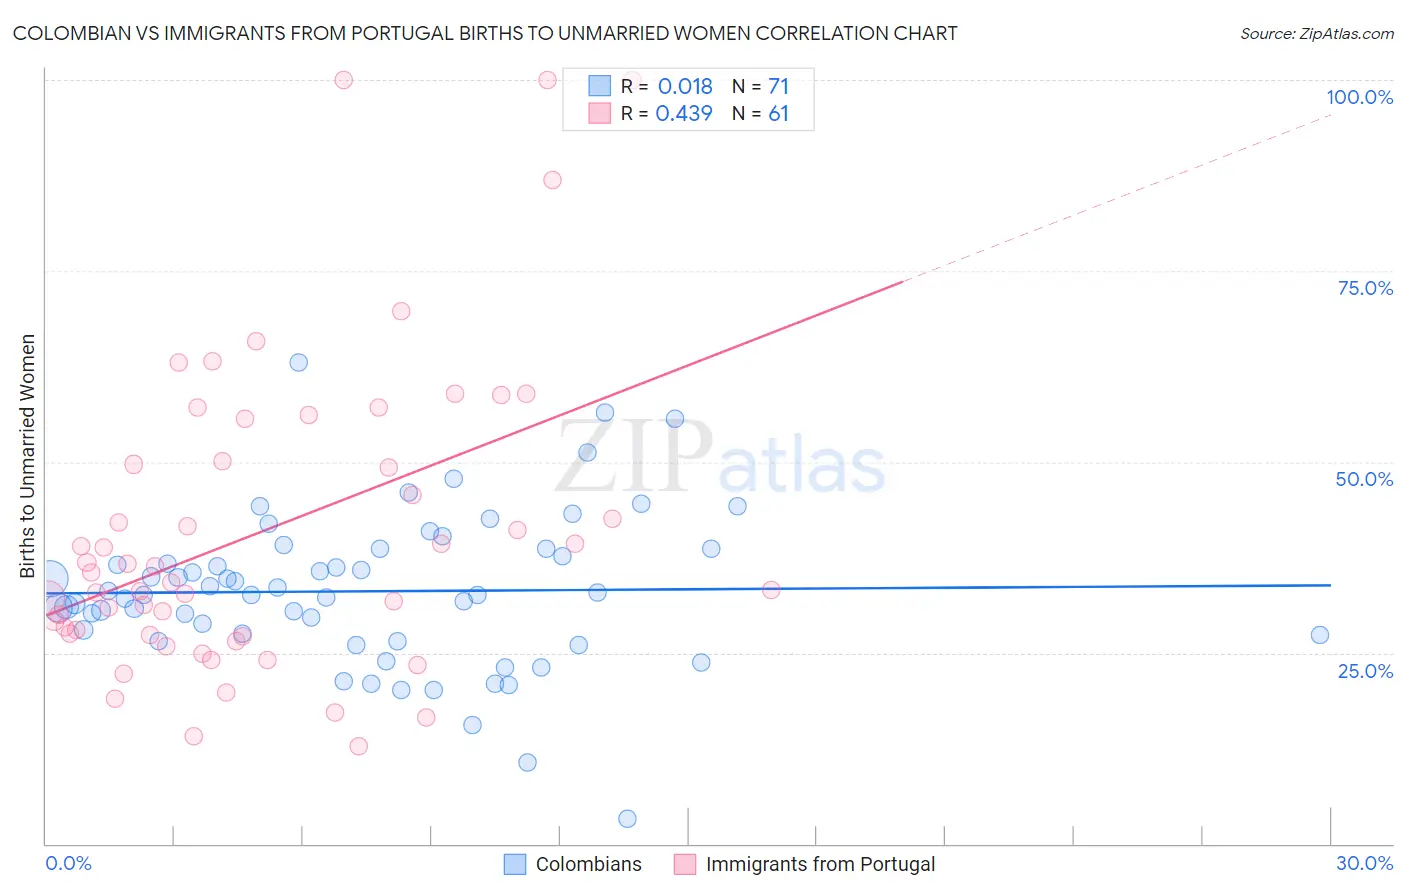
Colombian vs Immigrants from Portugal Births to Unmarried Women Correlation Chart
The statistical analysis conducted on geographies consisting of 391,716,321 people shows no correlation between the proportion of Colombians and percentage of births to unmarried women in the United States with a correlation coefficient (R) of 0.018 and weighted average of 32.2%. Similarly, the statistical analysis conducted on geographies consisting of 165,718,772 people shows a moderate positive correlation between the proportion of Immigrants from Portugal and percentage of births to unmarried women in the United States with a correlation coefficient (R) of 0.439 and weighted average of 36.2%, a difference of 12.2%.
Births to Unmarried Women Correlation Summary
| Measurement | Colombian | Immigrants from Portugal |
| Minimum | 3.3% | 12.7% |
| Maximum | 63.0% | 100.0% |
| Range | 59.7% | 87.3% |
| Mean | 33.1% | 41.1% |
| Median | 32.6% | 35.5% |
| Interquartile 25% (IQ1) | 27.3% | 27.5% |
| Interquartile 75% (IQ3) | 38.6% | 52.9% |
| Interquartile Range (IQR) | 11.3% | 25.4% |
| Standard Deviation (Sample) | 10.0% | 20.3% |
| Standard Deviation (Population) | 9.9% | 20.1% |
Similar Demographics by Births to Unmarried Women
Demographics Similar to Colombians by Births to Unmarried Women
In terms of births to unmarried women, the demographic groups most similar to Colombians are Irish (32.2%, a difference of 0.050%), Tlingit-Haida (32.2%, a difference of 0.080%), Fijian (32.3%, a difference of 0.090%), Sudanese (32.4%, a difference of 0.51%), and Immigrants from Kenya (32.1%, a difference of 0.52%).
| Demographics | Rating | Rank | Births to Unmarried Women |
| Germans | 39.5 /100 | #185 | Fair 32.0% |
| Welsh | 38.2 /100 | #186 | Fair 32.0% |
| Czechoslovakians | 38.0 /100 | #187 | Fair 32.0% |
| Osage | 37.1 /100 | #188 | Fair 32.1% |
| Immigrants | Kenya | 36.9 /100 | #189 | Fair 32.1% |
| Tlingit-Haida | 32.6 /100 | #190 | Fair 32.2% |
| Irish | 32.4 /100 | #191 | Fair 32.2% |
| Colombians | 31.9 /100 | #192 | Fair 32.2% |
| Fijians | 31.1 /100 | #193 | Fair 32.3% |
| Sudanese | 27.3 /100 | #194 | Fair 32.4% |
| Samoans | 21.9 /100 | #195 | Fair 32.6% |
| Immigrants | Colombia | 21.7 /100 | #196 | Fair 32.6% |
| Immigrants | Immigrants | 20.6 /100 | #197 | Fair 32.7% |
| Costa Ricans | 20.3 /100 | #198 | Fair 32.7% |
| Immigrants | Thailand | 18.9 /100 | #199 | Poor 32.8% |
Demographics Similar to Immigrants from Portugal by Births to Unmarried Women
In terms of births to unmarried women, the demographic groups most similar to Immigrants from Portugal are Potawatomi (36.2%, a difference of 0.22%), Chickasaw (36.3%, a difference of 0.36%), Immigrants from Trinidad and Tobago (36.3%, a difference of 0.36%), Immigrants from Grenada (36.3%, a difference of 0.39%), and Salvadoran (36.0%, a difference of 0.46%).
| Demographics | Rating | Rank | Births to Unmarried Women |
| Nigerians | 0.7 /100 | #246 | Tragic 35.3% |
| Immigrants | Nigeria | 0.7 /100 | #247 | Tragic 35.4% |
| Immigrants | Nonimmigrants | 0.6 /100 | #248 | Tragic 35.5% |
| Bermudans | 0.6 /100 | #249 | Tragic 35.5% |
| Mexican American Indians | 0.4 /100 | #250 | Tragic 35.7% |
| Immigrants | Western Africa | 0.3 /100 | #251 | Tragic 36.0% |
| Salvadorans | 0.3 /100 | #252 | Tragic 36.0% |
| Immigrants | Portugal | 0.2 /100 | #253 | Tragic 36.2% |
| Potawatomi | 0.2 /100 | #254 | Tragic 36.2% |
| Chickasaw | 0.2 /100 | #255 | Tragic 36.3% |
| Immigrants | Trinidad and Tobago | 0.2 /100 | #256 | Tragic 36.3% |
| Immigrants | Grenada | 0.2 /100 | #257 | Tragic 36.3% |
| Americans | 0.2 /100 | #258 | Tragic 36.4% |
| Immigrants | El Salvador | 0.2 /100 | #259 | Tragic 36.4% |
| Ottawa | 0.2 /100 | #260 | Tragic 36.5% |