Colombian vs Immigrants from Europe Births to Unmarried Women
COMPARE
Colombian
Immigrants from Europe
Births to Unmarried Women
Births to Unmarried Women Comparison
Colombians
Immigrants from Europe
32.2%
BIRTHS TO UNMARRIED WOMEN
31.9/ 100
METRIC RATING
192nd/ 347
METRIC RANK
28.4%
BIRTHS TO UNMARRIED WOMEN
98.7/ 100
METRIC RATING
68th/ 347
METRIC RANK
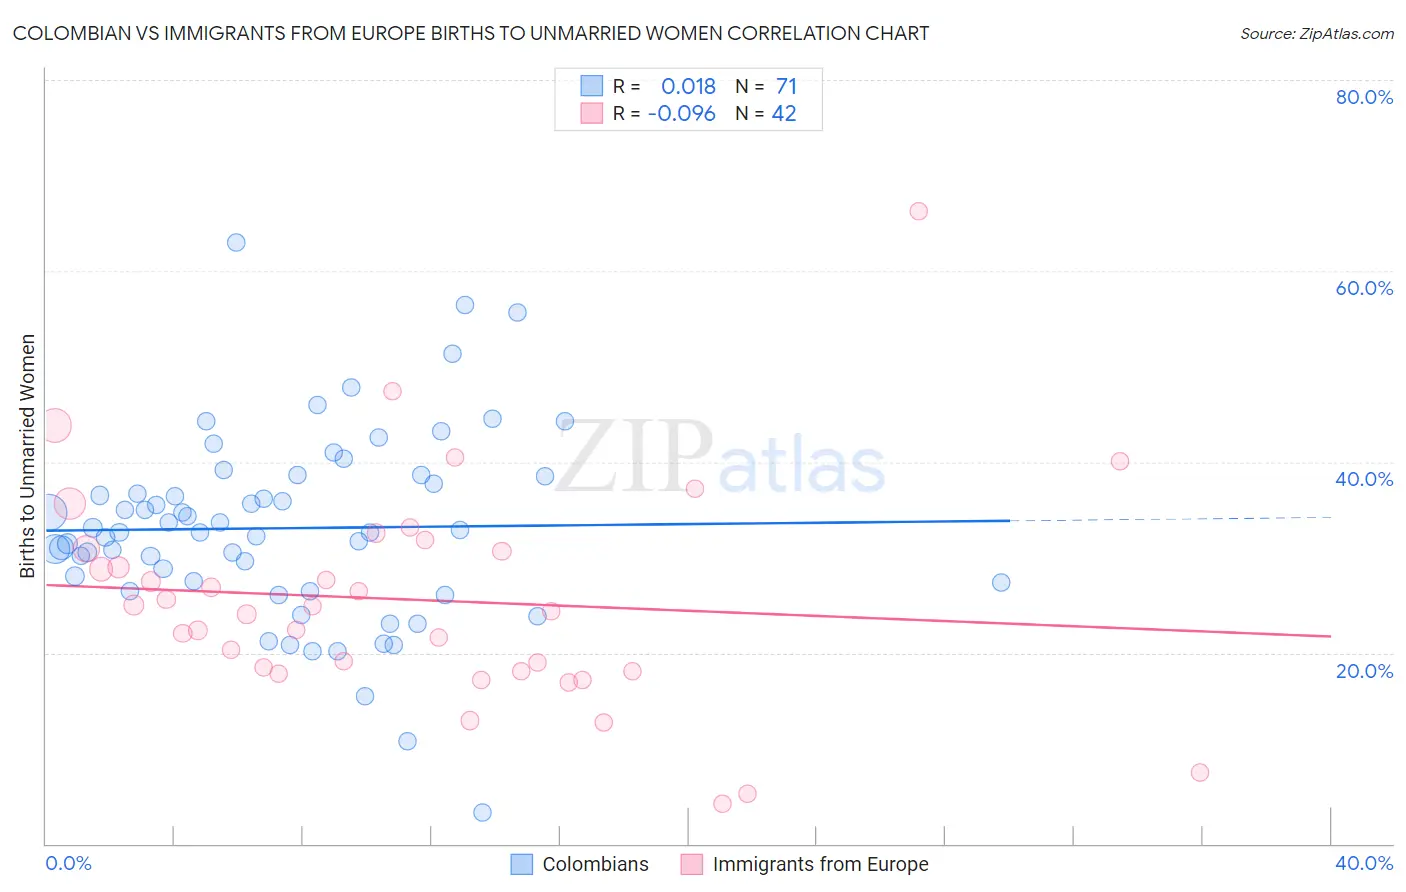
Colombian vs Immigrants from Europe Births to Unmarried Women Correlation Chart
The statistical analysis conducted on geographies consisting of 391,716,321 people shows no correlation between the proportion of Colombians and percentage of births to unmarried women in the United States with a correlation coefficient (R) of 0.018 and weighted average of 32.2%. Similarly, the statistical analysis conducted on geographies consisting of 491,178,975 people shows a slight negative correlation between the proportion of Immigrants from Europe and percentage of births to unmarried women in the United States with a correlation coefficient (R) of -0.096 and weighted average of 28.4%, a difference of 13.4%.
Births to Unmarried Women Correlation Summary
| Measurement | Colombian | Immigrants from Europe |
| Minimum | 3.3% | 4.2% |
| Maximum | 63.0% | 66.3% |
| Range | 59.7% | 62.1% |
| Mean | 33.1% | 25.5% |
| Median | 32.6% | 24.6% |
| Interquartile 25% (IQ1) | 27.3% | 18.1% |
| Interquartile 75% (IQ3) | 38.6% | 30.9% |
| Interquartile Range (IQR) | 11.3% | 12.8% |
| Standard Deviation (Sample) | 10.0% | 11.6% |
| Standard Deviation (Population) | 9.9% | 11.4% |
Similar Demographics by Births to Unmarried Women
Demographics Similar to Colombians by Births to Unmarried Women
In terms of births to unmarried women, the demographic groups most similar to Colombians are Irish (32.2%, a difference of 0.050%), Tlingit-Haida (32.2%, a difference of 0.080%), Fijian (32.3%, a difference of 0.090%), Sudanese (32.4%, a difference of 0.51%), and Immigrants from Kenya (32.1%, a difference of 0.52%).
| Demographics | Rating | Rank | Births to Unmarried Women |
| Germans | 39.5 /100 | #185 | Fair 32.0% |
| Welsh | 38.2 /100 | #186 | Fair 32.0% |
| Czechoslovakians | 38.0 /100 | #187 | Fair 32.0% |
| Osage | 37.1 /100 | #188 | Fair 32.1% |
| Immigrants | Kenya | 36.9 /100 | #189 | Fair 32.1% |
| Tlingit-Haida | 32.6 /100 | #190 | Fair 32.2% |
| Irish | 32.4 /100 | #191 | Fair 32.2% |
| Colombians | 31.9 /100 | #192 | Fair 32.2% |
| Fijians | 31.1 /100 | #193 | Fair 32.3% |
| Sudanese | 27.3 /100 | #194 | Fair 32.4% |
| Samoans | 21.9 /100 | #195 | Fair 32.6% |
| Immigrants | Colombia | 21.7 /100 | #196 | Fair 32.6% |
| Immigrants | Immigrants | 20.6 /100 | #197 | Fair 32.7% |
| Costa Ricans | 20.3 /100 | #198 | Fair 32.7% |
| Immigrants | Thailand | 18.9 /100 | #199 | Poor 32.8% |
Demographics Similar to Immigrants from Europe by Births to Unmarried Women
In terms of births to unmarried women, the demographic groups most similar to Immigrants from Europe are Bolivian (28.5%, a difference of 0.040%), Palestinian (28.4%, a difference of 0.050%), Laotian (28.5%, a difference of 0.10%), Immigrants from Egypt (28.4%, a difference of 0.16%), and Immigrants from Czechoslovakia (28.4%, a difference of 0.18%).
| Demographics | Rating | Rank | Births to Unmarried Women |
| Immigrants | North Macedonia | 99.1 /100 | #61 | Exceptional 28.1% |
| Egyptians | 99.0 /100 | #62 | Exceptional 28.2% |
| Immigrants | Serbia | 98.9 /100 | #63 | Exceptional 28.3% |
| Tongans | 98.8 /100 | #64 | Exceptional 28.4% |
| Immigrants | Czechoslovakia | 98.8 /100 | #65 | Exceptional 28.4% |
| Immigrants | Egypt | 98.8 /100 | #66 | Exceptional 28.4% |
| Palestinians | 98.7 /100 | #67 | Exceptional 28.4% |
| Immigrants | Europe | 98.7 /100 | #68 | Exceptional 28.4% |
| Bolivians | 98.7 /100 | #69 | Exceptional 28.5% |
| Laotians | 98.6 /100 | #70 | Exceptional 28.5% |
| Jordanians | 98.5 /100 | #71 | Exceptional 28.5% |
| Immigrants | Sweden | 98.5 /100 | #72 | Exceptional 28.5% |
| Albanians | 98.5 /100 | #73 | Exceptional 28.5% |
| Immigrants | Bolivia | 98.5 /100 | #74 | Exceptional 28.6% |
| Immigrants | Switzerland | 98.4 /100 | #75 | Exceptional 28.6% |