Immigrants from Israel vs Immigrants from Portugal Births to Unmarried Women
COMPARE
Immigrants from Israel
Immigrants from Portugal
Births to Unmarried Women
Births to Unmarried Women Comparison
Immigrants from Israel
Immigrants from Portugal
25.1%
BIRTHS TO UNMARRIED WOMEN
100.0/ 100
METRIC RATING
11th/ 347
METRIC RANK
36.2%
BIRTHS TO UNMARRIED WOMEN
0.2/ 100
METRIC RATING
253rd/ 347
METRIC RANK
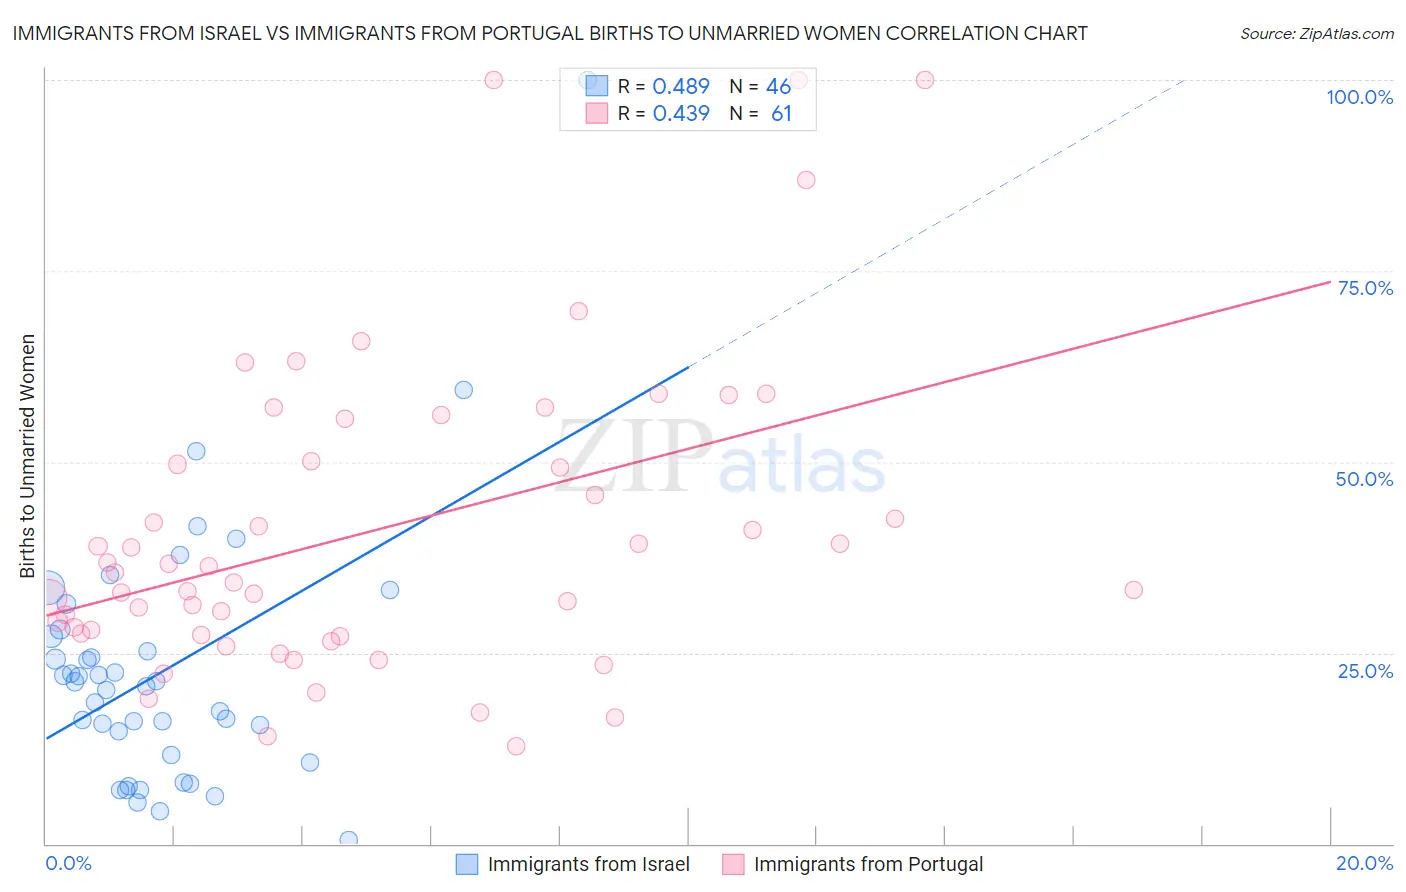
Immigrants from Israel vs Immigrants from Portugal Births to Unmarried Women Correlation Chart
The statistical analysis conducted on geographies consisting of 198,005,914 people shows a moderate positive correlation between the proportion of Immigrants from Israel and percentage of births to unmarried women in the United States with a correlation coefficient (R) of 0.489 and weighted average of 25.1%. Similarly, the statistical analysis conducted on geographies consisting of 165,718,772 people shows a moderate positive correlation between the proportion of Immigrants from Portugal and percentage of births to unmarried women in the United States with a correlation coefficient (R) of 0.439 and weighted average of 36.2%, a difference of 43.8%.
Births to Unmarried Women Correlation Summary
| Measurement | Immigrants from Israel | Immigrants from Portugal |
| Minimum | 0.50% | 12.7% |
| Maximum | 100.0% | 100.0% |
| Range | 99.5% | 87.3% |
| Mean | 22.6% | 41.1% |
| Median | 20.9% | 35.5% |
| Interquartile 25% (IQ1) | 11.6% | 27.5% |
| Interquartile 75% (IQ3) | 27.2% | 52.9% |
| Interquartile Range (IQR) | 15.6% | 25.4% |
| Standard Deviation (Sample) | 17.0% | 20.3% |
| Standard Deviation (Population) | 16.8% | 20.1% |
Similar Demographics by Births to Unmarried Women
Demographics Similar to Immigrants from Israel by Births to Unmarried Women
In terms of births to unmarried women, the demographic groups most similar to Immigrants from Israel are Immigrants from Eastern Asia (25.0%, a difference of 0.42%), Indian (Asian) (25.3%, a difference of 0.47%), Iranian (25.3%, a difference of 0.61%), Immigrants from Lebanon (25.3%, a difference of 0.73%), and Immigrants from South Central Asia (24.7%, a difference of 1.9%).
| Demographics | Rating | Rank | Births to Unmarried Women |
| Immigrants | Taiwan | 100.0 /100 | #4 | Exceptional 23.0% |
| Immigrants | Hong Kong | 100.0 /100 | #5 | Exceptional 23.6% |
| Immigrants | Iran | 100.0 /100 | #6 | Exceptional 24.0% |
| Thais | 100.0 /100 | #7 | Exceptional 24.0% |
| Immigrants | China | 100.0 /100 | #8 | Exceptional 24.7% |
| Immigrants | South Central Asia | 100.0 /100 | #9 | Exceptional 24.7% |
| Immigrants | Eastern Asia | 100.0 /100 | #10 | Exceptional 25.0% |
| Immigrants | Israel | 100.0 /100 | #11 | Exceptional 25.1% |
| Indians (Asian) | 100.0 /100 | #12 | Exceptional 25.3% |
| Iranians | 100.0 /100 | #13 | Exceptional 25.3% |
| Immigrants | Lebanon | 100.0 /100 | #14 | Exceptional 25.3% |
| Immigrants | Singapore | 100.0 /100 | #15 | Exceptional 25.6% |
| Immigrants | Belarus | 100.0 /100 | #16 | Exceptional 25.6% |
| Immigrants | Uzbekistan | 100.0 /100 | #17 | Exceptional 25.8% |
| Immigrants | Armenia | 99.9 /100 | #18 | Exceptional 26.1% |
Demographics Similar to Immigrants from Portugal by Births to Unmarried Women
In terms of births to unmarried women, the demographic groups most similar to Immigrants from Portugal are Potawatomi (36.2%, a difference of 0.22%), Chickasaw (36.3%, a difference of 0.36%), Immigrants from Trinidad and Tobago (36.3%, a difference of 0.36%), Immigrants from Grenada (36.3%, a difference of 0.39%), and Salvadoran (36.0%, a difference of 0.46%).
| Demographics | Rating | Rank | Births to Unmarried Women |
| Nigerians | 0.7 /100 | #246 | Tragic 35.3% |
| Immigrants | Nigeria | 0.7 /100 | #247 | Tragic 35.4% |
| Immigrants | Nonimmigrants | 0.6 /100 | #248 | Tragic 35.5% |
| Bermudans | 0.6 /100 | #249 | Tragic 35.5% |
| Mexican American Indians | 0.4 /100 | #250 | Tragic 35.7% |
| Immigrants | Western Africa | 0.3 /100 | #251 | Tragic 36.0% |
| Salvadorans | 0.3 /100 | #252 | Tragic 36.0% |
| Immigrants | Portugal | 0.2 /100 | #253 | Tragic 36.2% |
| Potawatomi | 0.2 /100 | #254 | Tragic 36.2% |
| Chickasaw | 0.2 /100 | #255 | Tragic 36.3% |
| Immigrants | Trinidad and Tobago | 0.2 /100 | #256 | Tragic 36.3% |
| Immigrants | Grenada | 0.2 /100 | #257 | Tragic 36.3% |
| Americans | 0.2 /100 | #258 | Tragic 36.4% |
| Immigrants | El Salvador | 0.2 /100 | #259 | Tragic 36.4% |
| Ottawa | 0.2 /100 | #260 | Tragic 36.5% |