Colombian vs Spanish American Births to Unmarried Women
COMPARE
Colombian
Spanish American
Births to Unmarried Women
Births to Unmarried Women Comparison
Colombians
Spanish Americans
32.2%
BIRTHS TO UNMARRIED WOMEN
31.9/ 100
METRIC RATING
192nd/ 347
METRIC RANK
38.6%
BIRTHS TO UNMARRIED WOMEN
0.0/ 100
METRIC RATING
299th/ 347
METRIC RANK
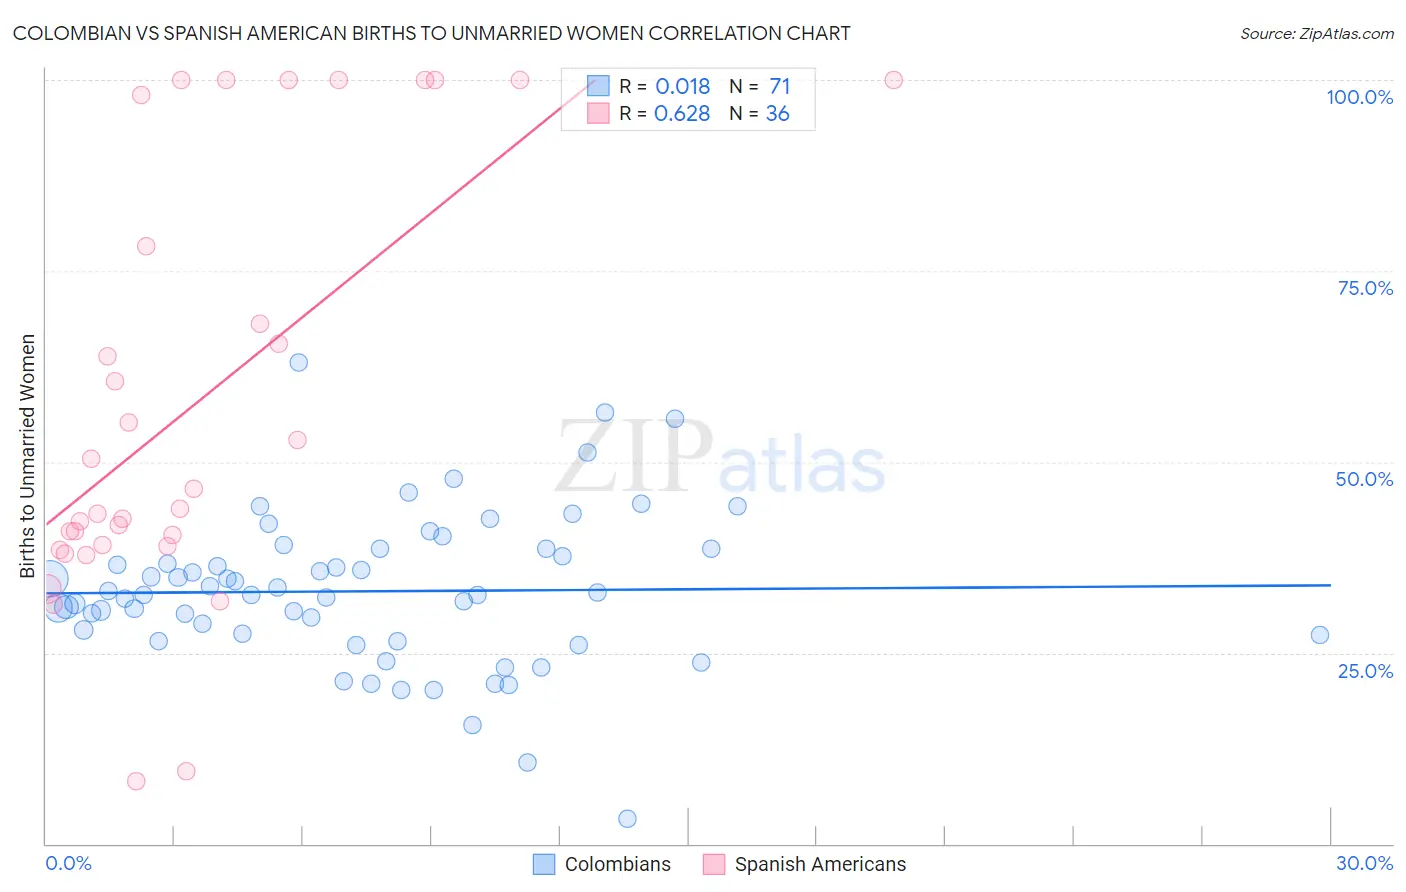
Colombian vs Spanish American Births to Unmarried Women Correlation Chart
The statistical analysis conducted on geographies consisting of 391,716,321 people shows no correlation between the proportion of Colombians and percentage of births to unmarried women in the United States with a correlation coefficient (R) of 0.018 and weighted average of 32.2%. Similarly, the statistical analysis conducted on geographies consisting of 101,589,972 people shows a significant positive correlation between the proportion of Spanish Americans and percentage of births to unmarried women in the United States with a correlation coefficient (R) of 0.628 and weighted average of 38.6%, a difference of 19.6%.
Births to Unmarried Women Correlation Summary
| Measurement | Colombian | Spanish American |
| Minimum | 3.3% | 8.2% |
| Maximum | 63.0% | 100.0% |
| Range | 59.7% | 91.8% |
| Mean | 33.1% | 57.8% |
| Median | 32.6% | 45.1% |
| Interquartile 25% (IQ1) | 27.3% | 39.1% |
| Interquartile 75% (IQ3) | 38.6% | 88.1% |
| Interquartile Range (IQR) | 11.3% | 49.1% |
| Standard Deviation (Sample) | 10.0% | 28.0% |
| Standard Deviation (Population) | 9.9% | 27.6% |
Similar Demographics by Births to Unmarried Women
Demographics Similar to Colombians by Births to Unmarried Women
In terms of births to unmarried women, the demographic groups most similar to Colombians are Irish (32.2%, a difference of 0.050%), Tlingit-Haida (32.2%, a difference of 0.080%), Fijian (32.3%, a difference of 0.090%), Sudanese (32.4%, a difference of 0.51%), and Immigrants from Kenya (32.1%, a difference of 0.52%).
| Demographics | Rating | Rank | Births to Unmarried Women |
| Germans | 39.5 /100 | #185 | Fair 32.0% |
| Welsh | 38.2 /100 | #186 | Fair 32.0% |
| Czechoslovakians | 38.0 /100 | #187 | Fair 32.0% |
| Osage | 37.1 /100 | #188 | Fair 32.1% |
| Immigrants | Kenya | 36.9 /100 | #189 | Fair 32.1% |
| Tlingit-Haida | 32.6 /100 | #190 | Fair 32.2% |
| Irish | 32.4 /100 | #191 | Fair 32.2% |
| Colombians | 31.9 /100 | #192 | Fair 32.2% |
| Fijians | 31.1 /100 | #193 | Fair 32.3% |
| Sudanese | 27.3 /100 | #194 | Fair 32.4% |
| Samoans | 21.9 /100 | #195 | Fair 32.6% |
| Immigrants | Colombia | 21.7 /100 | #196 | Fair 32.6% |
| Immigrants | Immigrants | 20.6 /100 | #197 | Fair 32.7% |
| Costa Ricans | 20.3 /100 | #198 | Fair 32.7% |
| Immigrants | Thailand | 18.9 /100 | #199 | Poor 32.8% |
Demographics Similar to Spanish Americans by Births to Unmarried Women
In terms of births to unmarried women, the demographic groups most similar to Spanish Americans are Immigrants from West Indies (38.6%, a difference of 0.060%), Haitian (38.6%, a difference of 0.070%), Jamaican (38.5%, a difference of 0.20%), Honduran (38.7%, a difference of 0.31%), and Dutch West Indian (38.4%, a difference of 0.40%).
| Demographics | Rating | Rank | Births to Unmarried Women |
| Blackfeet | 0.0 /100 | #292 | Tragic 37.9% |
| Immigrants | Nicaragua | 0.0 /100 | #293 | Tragic 38.0% |
| British West Indians | 0.0 /100 | #294 | Tragic 38.0% |
| Iroquois | 0.0 /100 | #295 | Tragic 38.2% |
| Alaska Natives | 0.0 /100 | #296 | Tragic 38.3% |
| Dutch West Indians | 0.0 /100 | #297 | Tragic 38.4% |
| Jamaicans | 0.0 /100 | #298 | Tragic 38.5% |
| Spanish Americans | 0.0 /100 | #299 | Tragic 38.6% |
| Immigrants | West Indies | 0.0 /100 | #300 | Tragic 38.6% |
| Haitians | 0.0 /100 | #301 | Tragic 38.6% |
| Hondurans | 0.0 /100 | #302 | Tragic 38.7% |
| Immigrants | Jamaica | 0.0 /100 | #303 | Tragic 38.8% |
| Yaqui | 0.0 /100 | #304 | Tragic 38.8% |
| Immigrants | Haiti | 0.0 /100 | #305 | Tragic 38.9% |
| Central American Indians | 0.0 /100 | #306 | Tragic 39.0% |