Eastern European vs Immigrants from Portugal Births to Unmarried Women
COMPARE
Eastern European
Immigrants from Portugal
Births to Unmarried Women
Births to Unmarried Women Comparison
Eastern Europeans
Immigrants from Portugal
27.7%
BIRTHS TO UNMARRIED WOMEN
99.5/ 100
METRIC RATING
48th/ 347
METRIC RANK
36.2%
BIRTHS TO UNMARRIED WOMEN
0.2/ 100
METRIC RATING
253rd/ 347
METRIC RANK
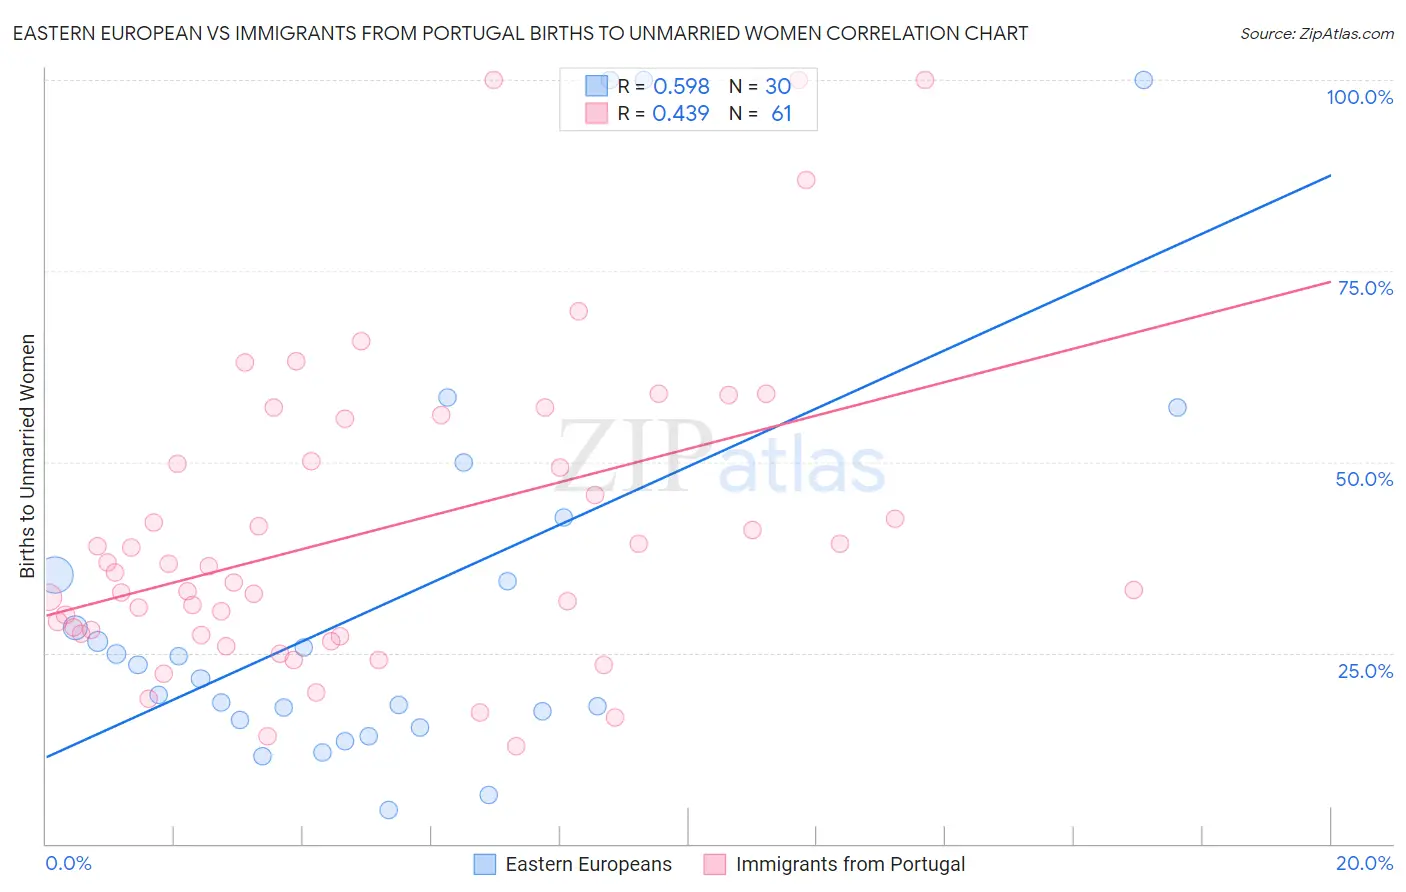
Eastern European vs Immigrants from Portugal Births to Unmarried Women Correlation Chart
The statistical analysis conducted on geographies consisting of 419,649,713 people shows a substantial positive correlation between the proportion of Eastern Europeans and percentage of births to unmarried women in the United States with a correlation coefficient (R) of 0.598 and weighted average of 27.7%. Similarly, the statistical analysis conducted on geographies consisting of 165,718,772 people shows a moderate positive correlation between the proportion of Immigrants from Portugal and percentage of births to unmarried women in the United States with a correlation coefficient (R) of 0.439 and weighted average of 36.2%, a difference of 30.4%.
Births to Unmarried Women Correlation Summary
| Measurement | Eastern European | Immigrants from Portugal |
| Minimum | 4.4% | 12.7% |
| Maximum | 100.0% | 100.0% |
| Range | 95.6% | 87.3% |
| Mean | 31.8% | 41.1% |
| Median | 22.6% | 35.5% |
| Interquartile 25% (IQ1) | 16.3% | 27.5% |
| Interquartile 75% (IQ3) | 35.2% | 52.9% |
| Interquartile Range (IQR) | 18.9% | 25.4% |
| Standard Deviation (Sample) | 26.7% | 20.3% |
| Standard Deviation (Population) | 26.2% | 20.1% |
Similar Demographics by Births to Unmarried Women
Demographics Similar to Eastern Europeans by Births to Unmarried Women
In terms of births to unmarried women, the demographic groups most similar to Eastern Europeans are Immigrants from Lithuania (27.7%, a difference of 0.010%), Hmong (27.7%, a difference of 0.010%), Latvian (27.7%, a difference of 0.060%), Immigrants from Indonesia (27.7%, a difference of 0.15%), and Immigrants from Greece (27.8%, a difference of 0.19%).
| Demographics | Rating | Rank | Births to Unmarried Women |
| Iraqis | 99.6 /100 | #41 | Exceptional 27.6% |
| Immigrants | Eastern Europe | 99.6 /100 | #42 | Exceptional 27.6% |
| Immigrants | Bulgaria | 99.6 /100 | #43 | Exceptional 27.6% |
| Immigrants | Indonesia | 99.5 /100 | #44 | Exceptional 27.7% |
| Latvians | 99.5 /100 | #45 | Exceptional 27.7% |
| Immigrants | Lithuania | 99.5 /100 | #46 | Exceptional 27.7% |
| Hmong | 99.5 /100 | #47 | Exceptional 27.7% |
| Eastern Europeans | 99.5 /100 | #48 | Exceptional 27.7% |
| Immigrants | Greece | 99.4 /100 | #49 | Exceptional 27.8% |
| Maltese | 99.4 /100 | #50 | Exceptional 27.8% |
| Macedonians | 99.4 /100 | #51 | Exceptional 27.9% |
| Bhutanese | 99.4 /100 | #52 | Exceptional 27.9% |
| Immigrants | Romania | 99.4 /100 | #53 | Exceptional 27.9% |
| Afghans | 99.4 /100 | #54 | Exceptional 27.9% |
| Mongolians | 99.3 /100 | #55 | Exceptional 27.9% |
Demographics Similar to Immigrants from Portugal by Births to Unmarried Women
In terms of births to unmarried women, the demographic groups most similar to Immigrants from Portugal are Potawatomi (36.2%, a difference of 0.22%), Chickasaw (36.3%, a difference of 0.36%), Immigrants from Trinidad and Tobago (36.3%, a difference of 0.36%), Immigrants from Grenada (36.3%, a difference of 0.39%), and Salvadoran (36.0%, a difference of 0.46%).
| Demographics | Rating | Rank | Births to Unmarried Women |
| Nigerians | 0.7 /100 | #246 | Tragic 35.3% |
| Immigrants | Nigeria | 0.7 /100 | #247 | Tragic 35.4% |
| Immigrants | Nonimmigrants | 0.6 /100 | #248 | Tragic 35.5% |
| Bermudans | 0.6 /100 | #249 | Tragic 35.5% |
| Mexican American Indians | 0.4 /100 | #250 | Tragic 35.7% |
| Immigrants | Western Africa | 0.3 /100 | #251 | Tragic 36.0% |
| Salvadorans | 0.3 /100 | #252 | Tragic 36.0% |
| Immigrants | Portugal | 0.2 /100 | #253 | Tragic 36.2% |
| Potawatomi | 0.2 /100 | #254 | Tragic 36.2% |
| Chickasaw | 0.2 /100 | #255 | Tragic 36.3% |
| Immigrants | Trinidad and Tobago | 0.2 /100 | #256 | Tragic 36.3% |
| Immigrants | Grenada | 0.2 /100 | #257 | Tragic 36.3% |
| Americans | 0.2 /100 | #258 | Tragic 36.4% |
| Immigrants | El Salvador | 0.2 /100 | #259 | Tragic 36.4% |
| Ottawa | 0.2 /100 | #260 | Tragic 36.5% |