Immigrants from Somalia vs Cheyenne Births to Unmarried Women
COMPARE
Immigrants from Somalia
Cheyenne
Births to Unmarried Women
Births to Unmarried Women Comparison
Immigrants from Somalia
Cheyenne
31.4%
BIRTHS TO UNMARRIED WOMEN
58.1/ 100
METRIC RATING
165th/ 347
METRIC RANK
41.3%
BIRTHS TO UNMARRIED WOMEN
0.0/ 100
METRIC RATING
325th/ 347
METRIC RANK
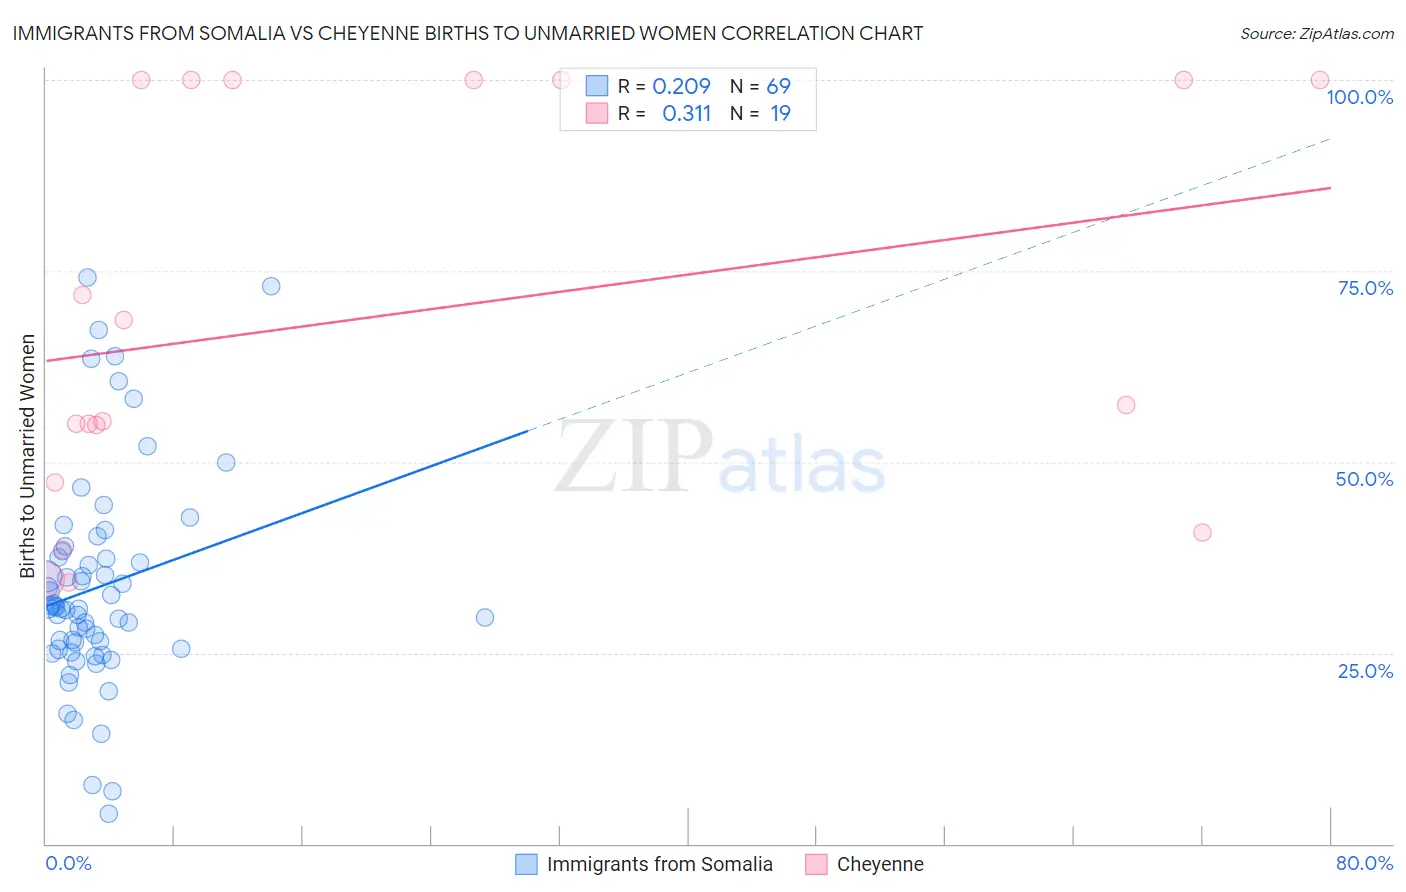
Immigrants from Somalia vs Cheyenne Births to Unmarried Women Correlation Chart
The statistical analysis conducted on geographies consisting of 90,738,238 people shows a weak positive correlation between the proportion of Immigrants from Somalia and percentage of births to unmarried women in the United States with a correlation coefficient (R) of 0.209 and weighted average of 31.4%. Similarly, the statistical analysis conducted on geographies consisting of 79,528,425 people shows a mild positive correlation between the proportion of Cheyenne and percentage of births to unmarried women in the United States with a correlation coefficient (R) of 0.311 and weighted average of 41.3%, a difference of 31.6%.
Births to Unmarried Women Correlation Summary
| Measurement | Immigrants from Somalia | Cheyenne |
| Minimum | 4.0% | 34.1% |
| Maximum | 74.1% | 100.0% |
| Range | 70.1% | 65.9% |
| Mean | 33.6% | 69.1% |
| Median | 30.9% | 57.4% |
| Interquartile 25% (IQ1) | 25.5% | 47.3% |
| Interquartile 75% (IQ3) | 37.8% | 100.0% |
| Interquartile Range (IQR) | 12.3% | 52.7% |
| Standard Deviation (Sample) | 14.1% | 26.1% |
| Standard Deviation (Population) | 14.0% | 25.4% |
Similar Demographics by Births to Unmarried Women
Demographics Similar to Immigrants from Somalia by Births to Unmarried Women
In terms of births to unmarried women, the demographic groups most similar to Immigrants from Somalia are Peruvian (31.5%, a difference of 0.25%), Dutch (31.5%, a difference of 0.28%), Belgian (31.6%, a difference of 0.55%), Slavic (31.6%, a difference of 0.59%), and Hungarian (31.2%, a difference of 0.60%).
| Demographics | Rating | Rank | Births to Unmarried Women |
| Austrians | 69.9 /100 | #158 | Good 31.0% |
| Immigrants | England | 69.4 /100 | #159 | Good 31.1% |
| Immigrants | Western Europe | 69.3 /100 | #160 | Good 31.1% |
| Immigrants | Southern Europe | 68.7 /100 | #161 | Good 31.1% |
| Slovenes | 65.9 /100 | #162 | Good 31.2% |
| Immigrants | Chile | 65.7 /100 | #163 | Good 31.2% |
| Hungarians | 64.1 /100 | #164 | Good 31.2% |
| Immigrants | Somalia | 58.1 /100 | #165 | Average 31.4% |
| Peruvians | 55.5 /100 | #166 | Average 31.5% |
| Dutch | 55.3 /100 | #167 | Average 31.5% |
| Belgians | 52.4 /100 | #168 | Average 31.6% |
| Slavs | 52.0 /100 | #169 | Average 31.6% |
| Guamanians/Chamorros | 51.3 /100 | #170 | Average 31.6% |
| Finns | 50.5 /100 | #171 | Average 31.7% |
| Immigrants | Eritrea | 50.4 /100 | #172 | Average 31.7% |
Demographics Similar to Cheyenne by Births to Unmarried Women
In terms of births to unmarried women, the demographic groups most similar to Cheyenne are Cape Verdean (41.3%, a difference of 0.060%), Immigrants from Cuba (41.5%, a difference of 0.27%), Sioux (41.0%, a difference of 0.85%), Cajun (41.0%, a difference of 0.93%), and Bahamian (40.8%, a difference of 1.4%).
| Demographics | Rating | Rank | Births to Unmarried Women |
| Immigrants | Bahamas | 0.0 /100 | #318 | Tragic 40.1% |
| Yakama | 0.0 /100 | #319 | Tragic 40.3% |
| Crow | 0.0 /100 | #320 | Tragic 40.4% |
| Bahamians | 0.0 /100 | #321 | Tragic 40.8% |
| Cajuns | 0.0 /100 | #322 | Tragic 41.0% |
| Sioux | 0.0 /100 | #323 | Tragic 41.0% |
| Cape Verdeans | 0.0 /100 | #324 | Tragic 41.3% |
| Cheyenne | 0.0 /100 | #325 | Tragic 41.3% |
| Immigrants | Cuba | 0.0 /100 | #326 | Tragic 41.5% |
| Tsimshian | 0.0 /100 | #327 | Tragic 42.2% |
| Immigrants | Cabo Verde | 0.0 /100 | #328 | Tragic 42.2% |
| Paiute | 0.0 /100 | #329 | Tragic 42.5% |
| Chippewa | 0.0 /100 | #330 | Tragic 42.6% |
| Natives/Alaskans | 0.0 /100 | #331 | Tragic 43.0% |
| Kiowa | 0.0 /100 | #332 | Tragic 43.1% |