Indian (Asian) vs Immigrants from Austria Currently Married
COMPARE
Indian (Asian)
Immigrants from Austria
Currently Married
Currently Married Comparison
Indians (Asian)
Immigrants from Austria
48.0%
CURRENTLY MARRIED
95.8/ 100
METRIC RATING
89th/ 347
METRIC RANK
48.5%
CURRENTLY MARRIED
98.8/ 100
METRIC RATING
53rd/ 347
METRIC RANK
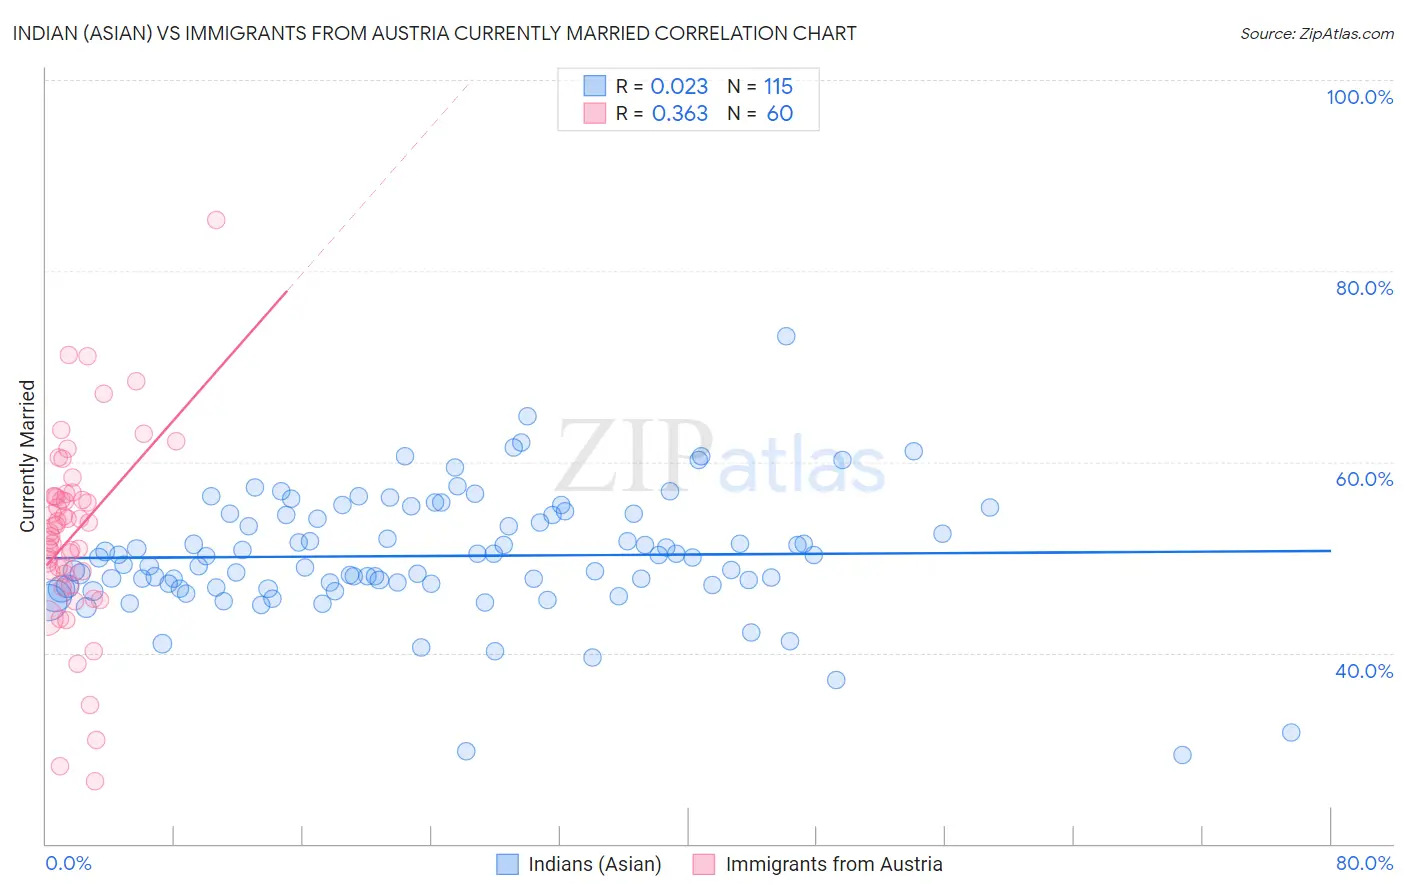
Indian (Asian) vs Immigrants from Austria Currently Married Correlation Chart
The statistical analysis conducted on geographies consisting of 495,221,745 people shows no correlation between the proportion of Indians (Asian) and percentage of population currently married in the United States with a correlation coefficient (R) of 0.023 and weighted average of 48.0%. Similarly, the statistical analysis conducted on geographies consisting of 167,972,759 people shows a mild positive correlation between the proportion of Immigrants from Austria and percentage of population currently married in the United States with a correlation coefficient (R) of 0.363 and weighted average of 48.5%, a difference of 1.1%.
Currently Married Correlation Summary
| Measurement | Indian (Asian) | Immigrants from Austria |
| Minimum | 29.3% | 26.6% |
| Maximum | 73.2% | 85.3% |
| Range | 43.9% | 58.7% |
| Mean | 50.1% | 52.5% |
| Median | 50.0% | 52.9% |
| Interquartile 25% (IQ1) | 46.9% | 48.4% |
| Interquartile 75% (IQ3) | 54.5% | 56.4% |
| Interquartile Range (IQR) | 7.5% | 8.0% |
| Standard Deviation (Sample) | 6.5% | 10.0% |
| Standard Deviation (Population) | 6.4% | 9.9% |
Similar Demographics by Currently Married
Demographics Similar to Indians (Asian) by Currently Married
In terms of currently married, the demographic groups most similar to Indians (Asian) are American (48.0%, a difference of 0.020%), Immigrants from Bolivia (47.9%, a difference of 0.050%), Immigrants from Eastern Europe (48.0%, a difference of 0.060%), Jordanian (48.0%, a difference of 0.080%), and Immigrants from Japan (48.0%, a difference of 0.090%).
| Demographics | Rating | Rank | Currently Married |
| Immigrants | Europe | 96.9 /100 | #82 | Exceptional 48.1% |
| Bolivians | 96.9 /100 | #83 | Exceptional 48.1% |
| Immigrants | Israel | 96.9 /100 | #84 | Exceptional 48.1% |
| French Canadians | 96.3 /100 | #85 | Exceptional 48.0% |
| Immigrants | Japan | 96.2 /100 | #86 | Exceptional 48.0% |
| Jordanians | 96.2 /100 | #87 | Exceptional 48.0% |
| Immigrants | Eastern Europe | 96.1 /100 | #88 | Exceptional 48.0% |
| Indians (Asian) | 95.8 /100 | #89 | Exceptional 48.0% |
| Americans | 95.7 /100 | #90 | Exceptional 48.0% |
| Immigrants | Bolivia | 95.6 /100 | #91 | Exceptional 47.9% |
| Koreans | 95.4 /100 | #92 | Exceptional 47.9% |
| Lebanese | 95.1 /100 | #93 | Exceptional 47.9% |
| Native Hawaiians | 95.0 /100 | #94 | Exceptional 47.9% |
| Immigrants | Bulgaria | 94.8 /100 | #95 | Exceptional 47.9% |
| Egyptians | 94.8 /100 | #96 | Exceptional 47.9% |
Demographics Similar to Immigrants from Austria by Currently Married
In terms of currently married, the demographic groups most similar to Immigrants from Austria are Immigrants from Moldova (48.5%, a difference of 0.060%), Immigrants from North Macedonia (48.5%, a difference of 0.070%), Latvian (48.5%, a difference of 0.070%), Immigrants from Netherlands (48.5%, a difference of 0.10%), and Russian (48.6%, a difference of 0.12%).
| Demographics | Rating | Rank | Currently Married |
| Immigrants | Iran | 99.2 /100 | #46 | Exceptional 48.7% |
| Northern Europeans | 99.2 /100 | #47 | Exceptional 48.7% |
| Austrians | 99.2 /100 | #48 | Exceptional 48.7% |
| Bhutanese | 99.1 /100 | #49 | Exceptional 48.6% |
| Iranians | 99.0 /100 | #50 | Exceptional 48.6% |
| Whites/Caucasians | 99.0 /100 | #51 | Exceptional 48.6% |
| Russians | 98.9 /100 | #52 | Exceptional 48.6% |
| Immigrants | Austria | 98.8 /100 | #53 | Exceptional 48.5% |
| Immigrants | Moldova | 98.7 /100 | #54 | Exceptional 48.5% |
| Immigrants | North Macedonia | 98.7 /100 | #55 | Exceptional 48.5% |
| Latvians | 98.7 /100 | #56 | Exceptional 48.5% |
| Immigrants | Netherlands | 98.6 /100 | #57 | Exceptional 48.5% |
| French | 98.6 /100 | #58 | Exceptional 48.4% |
| Immigrants | Ireland | 98.5 /100 | #59 | Exceptional 48.4% |
| Immigrants | Romania | 98.5 /100 | #60 | Exceptional 48.4% |